147 Age Categories in Late Adulthood
Martha Lally; Suzanne Valentine-French; and Dinesh Ramoo
There have been many ways to categorize the ages of individuals in late adulthood. In this chapter, we will be dividing the stage into three categories: young–old (sixty-five to eighty-four), oldest-old (eighty-five to ninety-nine), and centenarians (one hundred and older) for comparison. These categories are based on the conceptions of aging including, biological, psychological, social, and chronological differences. They also reflect the increase in longevity of those living to this latter stage.

Young-old: Older adults between the ages of sixty-five and eighty-four comprise the young-old category (Ortman et al., 2014). This time period has also been identified by Laslett (1989) as the “third age” because it follows childhood (the first age) and work and parenting (the second age). According to Barnes (2011a), this age category spans the post-employment years until approximately eighty to eighty-five years, when age-related limitations occur in the areas of physical, emotional, and cognitive development. Generally, this age span includes many positive aspects and is considered the “golden years” of adulthood. Why is it seen so positively?
Individuals at this age often have fewer responsibilities than in previous stages, and when combined with adequate finances and good health, they can pursue leisure and self-fulfillment opportunities. It is also an unusual age in that people are considered both in old age and not in old age (Rubinstein, 2002). When compared to those above eighty-five (known as the fourth age), the young-old experience relatively good health and social engagement (Smith, 2000), knowledge and expertise (Singer, Verhaeghen, Ghisletta, Lindenberger, and Baltes, 2003), and adaptive flexibility in daily living (Riediger, Freund, and Baltes, 2005). The young-old also show strong performance in attention, memory, and crystallized intelligence. In fact, those identified as young-old are more similar to those in midlife than those who are eighty-five and older. This group is less likely to require long-term care, to be dependent or poor, and more likely to be married, working for pleasure rather than income, and living independently. Chronic diseases, such as cardiovascular disease, hypertension, and cancer, are among the most common (especially later in this period), but because they are linked to lifestyle choices, they typically can be can prevented, lessoned, or managed (Barnes, 2011b). Overall, those in this age period feel a sense of happiness and emotional well-being that is better than at any other period of adulthood (Carstensen, Fung, and Charles, 2003; George, 2009; Robins and Trzesniewski, 2005).
Oldest-old: This age group is sometimes called the fourth age and often includes people who have more serious chronic ailments among the older adult population. In the US, the oldest-old represented 14 percente of the older adult population in 2015 (He, Goodkind, and Kowal, 2016). This age group is one of the fastest growing worldwide and is projected to increase more than 300 percent over its current levels (National Institute on Aging, 2015b). The oldest-old are projected to be nearly 18 million by 2050, or about 4.5 percent of the US population, compared with less than 2 percent of the population today. Women comprise more than 60 percent of those eighty-five and older, but they also suffer from more chronic illnesses and disabilities than older males (Gatz et al., 2016).

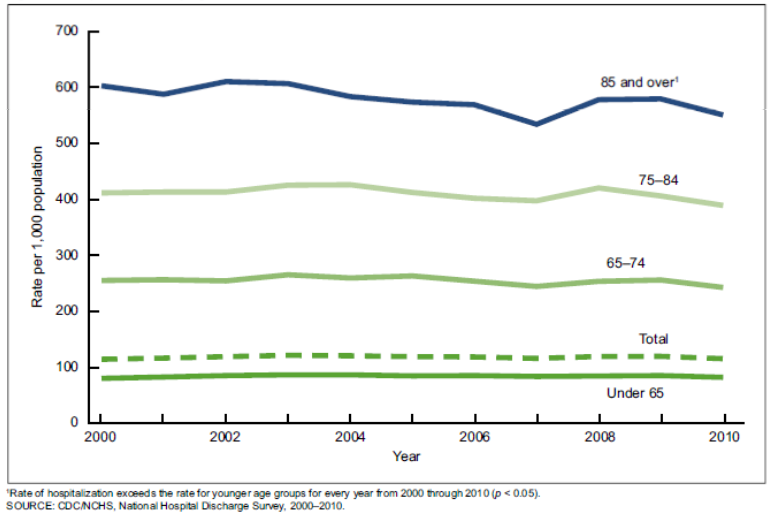
While this age group accounts for only 2 percent of the US population, it accounts for 9 percent of all hospitalizations (Levant, Chari, and DeFrances, 2015). Those eighty-five and older are less likely to be discharged and more likely to die in hospital. The most common reasons for hospitalization for the oldest-old are congestive heart failure, pneumonia, urinary tract infections, septicemia, stroke, and hip fractures. In recent years, hospitalizations for many of these medical problems have been reduced. However, hospitalization for urinary tract infections and septicemia has increased for the oldest-old.

Those eighty-five and older are more likely to require long-term care and to be in nursing homes than the youngest-old. Almost 50 percent of the oldest-old require some assistance with daily living activities (American Psychological Association, 2016). However, most still live in the community rather than a nursing home, as shown in Figure 9.7 (Stepler, 2016b). The oldest-old are less likely to be married and living with a spouse compared with the majority of the young-old (American Psychological Association, 2016; Stepler, 2016c). As can be seen in Figure 9.7, gender is also an important factor in the likelihood of being married or living with one’s spouse.
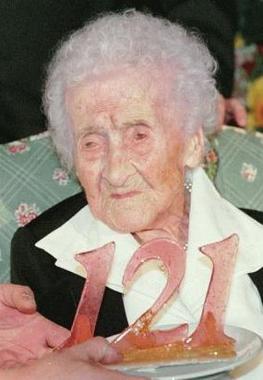
Centenarians: A segment of the oldest-old are centenarians, those who are 100 and older. Those who are 110 and older are sometimes referred to as the supercentarians (Wilcox, Wilcox, and Ferrucci, 2008). In 2015 there were nearly half a million centenarians worldwide, and it is estimated that this age group will grow to almost 3.7 million by 2050. The US has the most centenarians, but Japan and Italy have the most per capita (Stepler, 2016e). Most centenarians tended to be healthier than many of their peers as they were growing older, and often there was a delay in the onset of any serious disease or disability until their nineties. Additionally, 25 percent reached one hundred with no serious chronic illnesses, such as depression, osteoporosis, heart disease, respiratory illness, or dementia (Ash et al. 2015). Centenarians are more likely to experience a rapid terminal decline in later life, meaning that for most of their adulthood, and even older adult years, they are relatively healthy in comparison to many other older adults (Ash et al., 2015; Wilcox et al., 2008). According to Guinness World Records (2016), Jeanne Louise Calment has been documented to be the longest living person at 122 years and 164 days old (See Figure 9.8).

Media Attributions
- Figure 9 5 © Sonia Sevilla is licensed under a Public Domain license
- Figure 9 7 © Pew Research Center is licensed under a CC BY (Attribution) license

