132 Work and Leisure at Midlife
Martha Lally; Suzanne Valentine-French; and Dinesh Ramoo
Work
Who is the US workforce?: The civilian, non-institutionalized workforce (that is the population of those aged sixteen and older who are employed), has steadily declined since it reached its peak in the late 1990s, when 67 percent of the civilian workforce population was employed. In 2012 the rate had dropped to 64 percent and by 2022 it is projected to decline to 62 percent. The US population is expected to grow more slowly based on census projections for the next few years. Those new entrants to the labour force, adults aged sixteen to twenty-four, are the only population of adults that will shrink in size over the next few years by nearly half a percent, while those age fifty-five and up will grow by 2.3 percent over current rates, and those aged sixty-five to seventy-four will grow by nearly 4 percent (Monthly Labor Review, 2013). In 1992, 26 percent of the population was fifty-five and older, by 2022 it is projected to be 38 percent. Table 8.8 shows the rates of employment by age. In 2002, Baby Boomers were between the ages of thirty-eight and fifty-six, the prime employment group. In 2012, the youngest Baby Boomers were forty-eight and the oldest had just retired (age sixty-six). These changes might explain some of the steady decline in work participation as this large population cohort ages out of the workforce.
In 2012, 53 percent of the workforce was male. For both genders and for most age groups the rate of participation in the labour force has declined from 2002 to 2012, and it is projected to decline further by 2022. The exception is among the older middle-age groups (the Baby Boomers), and especially for women fifty-five and older.
| Age | Males | Females | ||||
| 2002 | 2012 | 2022* | 2002 | 2012 | 2022 | |
| 16–19 | 47.5 | 34 | 27.8 | 47.3 | 34.6 | 26.7 |
| 20–24 | 80.7 | 74.5 | 69.9 | 72.1 | 67.4 | 64.7 |
| 25–34 | 92.4 | 89.5 | 88.8 | 75.1 | 74.1 | 73.4 |
| 35–44 | 92.1 | 90.7 | 90.4 | 76.4 | 74.8 | 73.3 |
| 45–54 | 88.5 | 86.1 | 85.1 | 76 | 74.7 | 74.9 |
| 55–59 | 78 | 78 | 77.8 | 63.8 | 67.3 | 73.3 |
| 60–64 | 57.6 | 60.5 | 64.3 | 44.1 | 50.4 | 55.6 |
| 16+ totals | 74.1 | 70.2 | 67.6 | 59.6 | 57.7 | 56 |
Hispanic males have the highest rate of participation in the labour force. In 2012, 76 percent of Hispanic males, compared with 71 percent of white, 72 percent of Asian, and 64 percent of Black men ages sixteen or older were employed. Among women, Black women were more likely to be participating in the workforce (58 percent) compared with almost 57 percent of Hispanic and Asian, and 55 percent of white females. The rates for all racial and ethnic groups are expected to decline by 2022 (Monthly Labor Review, 2013).
Workplace climate for middle-aged adults: A number of studies have found that job satisfaction tends to peak in middle adulthood (Besen, Matz-Costa, Brown, Smyer, and Pitt- Catsouphers, 2013; Easterlin, 2006). This satisfaction stems from not only higher wages, but often greater involvement in decisions that affect the workplace as they move from worker to supervisor or manager. Job satisfaction is also influenced by being able to do the job well, and after years of experience at a job many people are more effective and productive. Another reason for this peak in job satisfaction is that at midlife many adults lower their expectations and goals (Tangri, Thomas, and Mednick, 2003). Middle-aged employees may realize they have reached the highest they are likely to reach in their career. This satisfaction at work translates into lower absenteeism, greater productivity, and less job hopping in comparison to younger adults (Easterlin, 2006).
However, not all middle-aged adults are happy in the workplace. Women may find themselves up against the glass ceiling, organizational discrimination in the workplace that limits the career advancement of women. This may explain why women employed at large corporations are twice as likely to quit their jobs as are men (Barreto, Ryan, and Schmitt, 2009). Another problem older workers may encounter is job burnout, becoming disillusioned and frustrated at work. American workers may experience more burnout than do workers in many other developed nations, because most developed nations guarantee by law a set number of paid vacation days (International Labour Organization, 2011), while the United States does not (US Department of Labor, 2016).
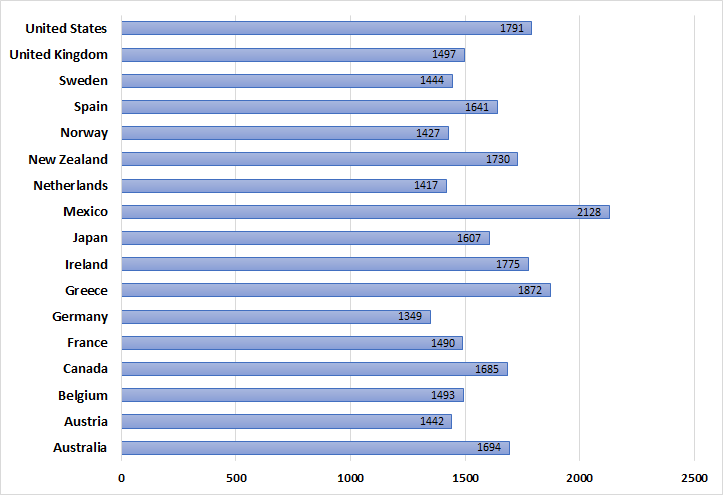
Not all employees are covered under overtime pay laws (US Department of Labor, 2016). This is important when you considered that the forty-hour work week is a myth for most Americans. Only 4 in 10 US workers work the typical forty-hour work week. The average work week for many is almost a full day longer (forty-seven hours), with 39 percent working fifty or more hours per week (Saad, 2014). In comparison to workers in many other developed nations, Canadian and American workers work more hours per year (Organisation for Economic Cooperation and Development, 2022). As can be seen in Figure 8.19, Canadians and Americans work more hours than most European nations, especially western and northern Europe, although they work less hours than workers in other nations, especially Mexico.
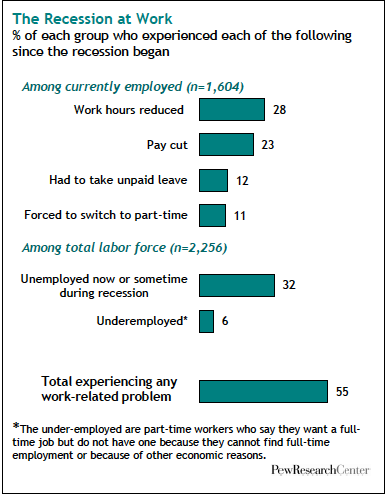
Workplace challenges for middle-aged adults: In recent years middle-aged adults have been challenged by economic downturns, starting in 2001, and again in 2008. Fifty-five percent of adults reported some problems in the workplace, such as fewer hours, pay cuts, having to switch to part-time, and so forth during the most recent economic recession (see Figure 8.20, Pew Research Center, 2010a). While young adults took the biggest hit in terms of levels of unemployment, middle-aged adults also saw their overall financial resources suffer as their retirement nest eggs disappeared, house values shrank, and foreclosures increased (Pew Research Center, 2010b). Not surprisingly, this age group reported that the recession hit them worse than did other age groups, especially those aged fifty to sixty-four. Middle-aged adults who find themselves unemployed are likely to remain unemployed longer than those in early adulthood (US Government Accountability Office, 2012). In the eyes of employers, it may be more cost effective to hire a young adult, despite their limited experience, as they would be starting out at lower levels of the pay scale. In addition, hiring someone who is twenty-five and has many years of work ahead of them versus someone who is fifty-five and will likely retire in ten years may also be part of the decision to hire a younger worker (Lachman, 2004). American workers are also competing with global markets and changes in technology. Those who are able to keep up with all these changes, or are willing to uproot and move around the country or even the world have a better chance of finding work. The decision to move may be easier for people who are younger and have fewer obligations to others.
Leisure
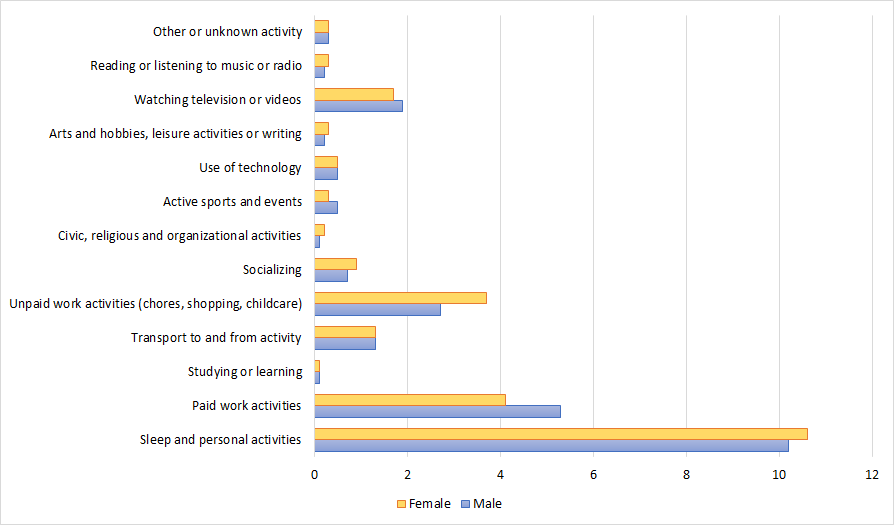
As most developed nations restrict the number of hours an employer can demand that an employee work per week and require employers to offer vacation time, what do middle-aged adults do with their time off from work and duties, referred to as leisure? Around the world the most common leisure activity in both early and middle adulthood is watching television (Marketing Charts Staff, 2014). On average, middle-aged adults spend two to three hours per day watching TV (Gripsrud, 2007) and watching TV accounts for more than half of all the leisure time. As seen in Figure 8.21, Canadians between the ages of forty-five and fifty-four spend more time watching television or videos and unpaid activities such as household chores, shopping, and childcare.
In the United States, men spend about five hours more per week in leisure activities, especially on weekends, than do women (Drake, 2013; US Bureau of Labor Statistics, 2016). The leisure gap between mothers and fathers is slightly smaller (about three hours a week) than among those without children under age eighteen (Drake, 2013). Those aged thirty-five to forty-four spend less time on leisure activities than any other age group, fifteen or older (US Bureau of Labor Statistics, 2016). This is not surprising as this age group are more likely to be parents and still working up the ladder of their career, so they may feel they have less time for leisure.
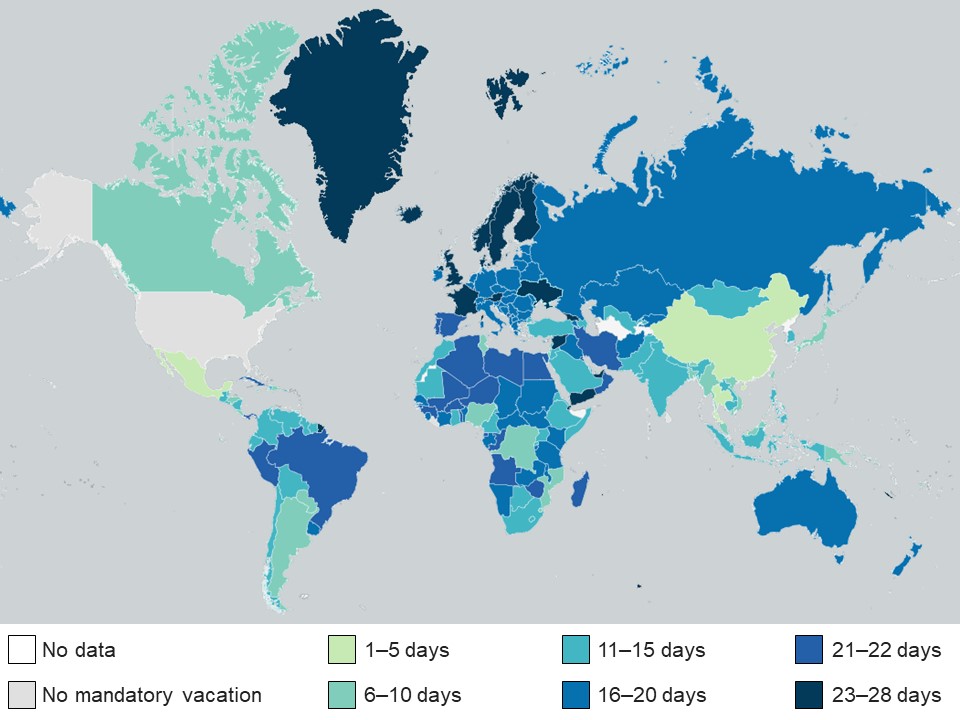
Americans have less leisure time than people in many other developed nations. As you read earlier, there are no laws in many job sectors guaranteeing paid vacation time in the United States (see Figure 8.22). Ray, Sanes, and Schmitt (2013) report that several other nations also provide additional time off for young and older workers and for shift workers. In the United States, those in higher paying jobs and jobs covered by a union contract are more likely to have paid vacation time and holidays (Ray and Schmitt, 2007).
Do US workers take their time off? According to Project Time-Off (2016), 55 percent of US workers in 2015 did not take all of their paid vacation and holiday leave. A large percentage of this leave is lost. It cannot be rolled over into the next year or paid out. A total of 658 million vacation days, or an average of two vacation days per worker, was lost in 2015. The reasons most often given for not taking time off was worry that there would be a mountain of work to return to (40 percent), concern that no one else could do the job (35 percent), not being able to afford a vacation (33 percent), feeling it was harder to take time away when you have or are moving up in the company (33 percent), and not wanting to seem replaceable (22 percent). Since 2000, more American workers are willing to work for free rather than take the time that is allowed to them. A lack of support from their bosses and even their colleagues to take a vacation is often a driving force in deciding to forgo time off. In fact, 80 percent of the respondents to the survey above said they would take time away if they felt they had support from their boss. Two-thirds reported that they hear nothing, mixed messages, or discouraging remarks about taking their time off. Almost a third (31 percent) feel they should contact their workplace even while on vacation.
The benefits of taking time away from work: Several studies have noted the benefits of taking time away from work. It reduces job-stress burnout (Nimrod, Kleiber, and Berdychevesky, 2012), improves both mental health (Qian, Yarnal, and Almeida, 2013) and physical health (Stern and Konno, 2009), especially if that leisure time also includes moderate physical activity (Lee et al., 2015). Leisure activities can also improve productivity and job satisfaction (Kühnel and Sonnentag, 2011) and help adults deal with balancing family and work obligations (Lee, et al., 2015).
Media Attributions
- Figure 8 19 © Dinesh Ramoo is licensed under a CC BY-SA (Attribution ShareAlike) license
- Figure 8 20 © Pew Research Center is licensed under a Public Domain license
- Figure 8 21 © Dinesh Ramoo is licensed under a CC BY-SA (Attribution ShareAlike) license
- Figure 8 22 © Guest2625, Dinesh Ramoo is licensed under a CC BY-SA (Attribution ShareAlike) license
