
2.1 Areas between Curves
Learning Objectives
- Determine the area of a region between two curves by integrating with respect to
 .
. - Find the area of a compound region.
- Determine the area of a region between two curves by integrating with respect to
 .
.
In Introduction to Integration, we developed the concept of the definite integral to calculate the area below a curve on a given interval. In this section, we expand that idea to calculate the area of more complex regions. We start by finding the area between two curves defined by the functions of  beginning with the simple case in which one function is always greater than the other. We then look at cases when the graphs of the functions intersect. Finally, we consider how to calculate the area between two curves whose equations express as a function of
Area of a Region between Two Curves
Let  and
and  be continuous functions over an interval
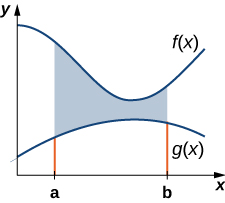
 ![\ds \left[a,b\right]](https://pressbooks.openedmb.ca/app/uploads/quicklatex/quicklatex.com-c3ac37860878a36cf1c719379b6192f8_l3.png "Rendered by QuickLaTeX.com") such that
such that  on
on ![\ds \left[a,b\right].](https://pressbooks.openedmb.ca/app/uploads/quicklatex/quicklatex.com-a79a232b9ebb8c1a0d37b37f5eb44d1b_l3.png "Rendered by QuickLaTeX.com") We want to find the area between the graphs of the functions, as shown in the following figure.
We want to find the area between the graphs of the functions, as shown in the following figure.
 and
and  on the interval
 As we did before, we are going to partition the interval on the  and approximate the area between the graphs of the functions with rectangles. So, for
  let
let  be a regular partition of Then, for
  choose a point
 ![\ds {x}_{i}^{*}\in \left[{x}_{i-1},{x}_{i}\right],](https://pressbooks.openedmb.ca/app/uploads/quicklatex/quicklatex.com-de5adeeb4b134b0549b3606f82de616d_l3.png "Rendered by QuickLaTeX.com") and on each interval
and on each interval ![\ds \left[{x}_{i-1},{x}_{i}\right]](https://pressbooks.openedmb.ca/app/uploads/quicklatex/quicklatex.com-dacbd8039d9febca4baa586c71099720_l3.png "Rendered by QuickLaTeX.com") construct a rectangle that extends vertically from
construct a rectangle that extends vertically from  to
to  Figure (a) shows the rectangles when
  is selected to be the left endpoint of the interval and
  Figure (b) shows a representative rectangle in detail.
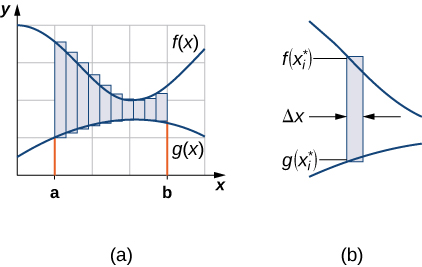 and with rectangles. (b) The area of a typical rectangle goes from one curve to the other.
The height of each individual rectangle is  and the width of each rectangle is
  Adding the areas of all the rectangles, we see that the area between the curves is approximated by
![\ds A\approx \underset{i=1}{\overset{n}{\sum}}\left[f({x}_{i}^{*})-g({x}_{i}^{*})\right]\Delta x.](https://pressbooks.openedmb.ca/app/uploads/quicklatex/quicklatex.com-59b7c95c85702971e5a8253840f123d3_l3.png "Rendered by QuickLaTeX.com")
This is a Riemann sum, so when we take the limit as  , we get
![\ds A=\underset{n\to \infty }{\text{lim}}\underset{i=1}{\overset{n}{\sum}}\left[f({x}_{i}^{*})-g({x}_{i}^{*})\right]\Delta x=\int\limits_{a}^{b}\left[f(x)-g(x)\right]\,dx .](https://pressbooks.openedmb.ca/app/uploads/quicklatex/quicklatex.com-f0f48ce1413c86102b93ac65fe92cd6d_l3.png "Rendered by QuickLaTeX.com")
These findings are summarized in the following theorem.
Finding the Area between Two Curves
Let and be continuous functions such that over an interval Let  denote the region bounded above by the graph of
  below by the graph of and on the left and right by the lines
  and
and  respectively. Then, the area of is given by
![\ds A=\int\limits_{a}^{b}\left[f(x)-g(x)\right]\,dx .](https://pressbooks.openedmb.ca/app/uploads/quicklatex/quicklatex.com-dee2e2249383d05f971cb2c083684716_l3.png "Rendered by QuickLaTeX.com")
We apply this theorem in the following example.
Finding the Area of a Region between Two Curves 1
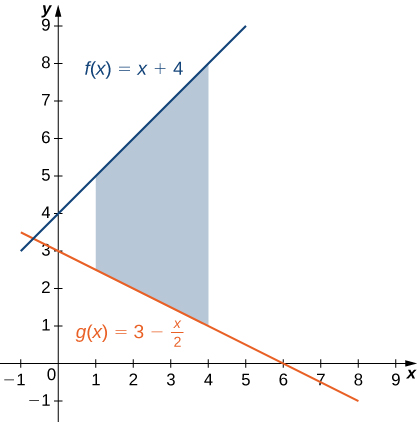
If R is the region bounded above by the graph of the function  and below by the graph of the function
  over the interval
 ![\ds \left[1,4\right],](https://pressbooks.openedmb.ca/app/uploads/quicklatex/quicklatex.com-0680ea80bef8abeae4191f6ed4d79677_l3.png "Rendered by QuickLaTeX.com") find the area of region
find the area of region 
Solution
The region is depicted in the following figure.
We have
![\ds \begin{array}{cc}\ds \hfill A&\ds =\int\limits_{a}^{b}\left[f(x)-g(x)\right]\,dx \hfill \\[5mm] &\ds =\int\limits_{1}^{4}\left[(x+4)-(3-\frac{x}{2})\right]\,dx =\int\limits_{1}^{4}\left[\frac{3x}{2}+1\right]\,dx \hfill \\[5mm] &\ds ={\left[\frac{3{x}^{2}}{4}+x\right]}\Big|_{1}^{4}=(16-\frac{7}{4})=\frac{57}{4}.\hfill \end{array}](https://pressbooks.openedmb.ca/app/uploads/quicklatex/quicklatex.com-6361cf5fe1f864dfbd78e4091972cbae_l3.png "Rendered by QuickLaTeX.com")
The area of the region is 
If is the region bounded by the graphs of the functions  and
and  over the interval
 ![\ds \left[1,5\right],](https://pressbooks.openedmb.ca/app/uploads/quicklatex/quicklatex.com-4f60775cb4c36f910a2cadc8218151ba_l3.png "Rendered by QuickLaTeX.com") find the area of region
find the area of region
Answer
12 units 2
In the above examples, we defined the interval of interest as part of the problem statement. Quite often, though, we want to define our interval of interest based on where the graphs of the two functions intersect. This is illustrated in the following example.
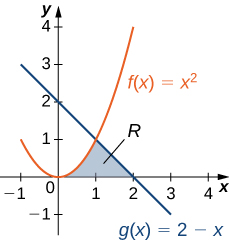
Finding the Area of a Region between Two Curves 2
If is the region bounded above by the graph of the function  and below by the graph of the function
  find the area of
Solution
The region is depicted in the following figure.
 and above the graph of
We first need to compute where the graphs of the functions intersect. Setting  we get
![\ds \begin{array}{ccc}\hfill f(x)&\ds =\hfill &\ds g(x)\hfill \\[2mm] \ds \hfill 9-{\left(\frac{x}{2}\right)}^{2}&\ds =\hfill &\ds 6-x\hfill \\[3mm] \ds \hfill 9-\frac{{x}^{2}}{4}&\ds =\hfill &\ds 6-x\hfill \\[3mm] \ds \hfill 36-{x}^{2}&\ds =\hfill &\ds 24-4x\hfill \\[2mm] \ds \hfill {x}^{2}-4x-12&\ds =\hfill &\ds 0\hfill \\[2mm] \ds \hfill (x-6)(x+2)&\ds =\hfill &\ds 0.\hfill \end{array}](https://pressbooks.openedmb.ca/app/uploads/quicklatex/quicklatex.com-5aba24b79e14937b190631eb5c437a2c_l3.png "Rendered by QuickLaTeX.com")
The graphs of the functions intersect when  or
or  so we want to integrate from -2 to 6. Since for
  we obtain
![\ds \begin{array}{cc}\ds \hfill A&\ds =\int\limits_{a}^{b}\left[f(x)-g(x)\right]\,dx \hfill \\[5mm] &\ds =\int\limits_{-2}^{6}\left[9-{(\frac{x}{2})}^{2}-(6-x)\right]\,dx =\int\limits_{-2}^{6}\left[3-\frac{{x}^{2}}{4}+x\right]\,dx \hfill \\[5mm] &\ds ={\left[3x-\frac{{x}^{3}}{12}+\frac{{x}^{2}}{2}\right]}\Big|_{-2}^{6}=\frac{64}{3}.\hfill \end{array}](https://pressbooks.openedmb.ca/app/uploads/quicklatex/quicklatex.com-4731385b130ba4681c2db5e744fc4845_l3.png "Rendered by QuickLaTeX.com")
The area of the region is  units 2 .
If R is the region bounded above by the graph of the function  and below by the graph of the function
  find the area of region
Answer
 unit 2
Areas of Compound Regions
So far, we have required over the entire interval of interest, but what if we want to look at regions bounded by the graphs of functions that cross one another? In that case, we modify the process we just developed by using the absolute value function.
Finding the Area of a Region between Intersecting Curves
Let and be continuous functions over an interval Let denote the region between the graphs of and and be bounded on the left and right by the lines and respectively. Then, the area of is given by

In practice, applying this theorem requires us to break up the interval and evaluate several integrals, depending on which of the function values is greater over a given part of the interval. We study this process in the following example.
Finding the Area of a Region Bounded by Intersecting Curves
If R is the region between the graphs of the functions  and
and  over the interval
 ![\ds \left[0,\pi \right],](https://pressbooks.openedmb.ca/app/uploads/quicklatex/quicklatex.com-f9fe68da0011fd367bf2b1a4ee7fae50_l3.png "Rendered by QuickLaTeX.com") find the area of region
find the area of region
Solution
The region is depicted in the following figure.
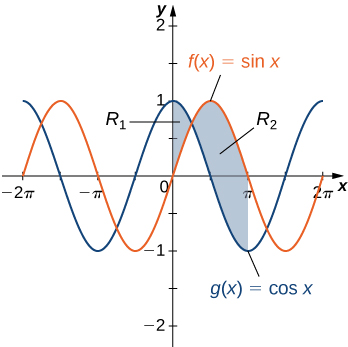
The graphs of the functions intersect at  For
For ![\ds x\in \left[0,\pi \text{/}4\right],](https://pressbooks.openedmb.ca/app/uploads/quicklatex/quicklatex.com-467bdbbfe8108d6c15c498d4b70d1557_l3.png "Rendered by QuickLaTeX.com")
 so
so

On the other hand, for ![\ds x\in \left[\pi \text{/}4,\pi \right],](https://pressbooks.openedmb.ca/app/uploads/quicklatex/quicklatex.com-8a0378247aa6539e9255d7651b20c782_l3.png "Rendered by QuickLaTeX.com")
 so
so

Then
![\ds \begin{array}{cc}\ds \hfill A&\ds =\int\limits_{a}^{b}|f(x)-g(x)|\,dx \hfill \\[5mm] &\ds =\int\limits_{0}^{\pi }| \sin (x)- \cos (x)|\,dx =\int\limits_{0}^{\pi \text{/}4}( \cos (x)- \sin (x))\,dx +\int\limits_{\pi \text{/}4}^{\pi }( \sin (x)- \cos (x))\,dx \hfill \\[5mm] &\ds ={\left[ \sin (x)+ \cos (x)\right]}\Big|_{0}^{\pi \text{/}4}+{\left[- \cos (x)- \sin (x)\right]}\Big|_{\pi \text{/}4}^{\pi }\hfill \\[5mm] &\ds =(\sqrt{2}-1)+(1+\sqrt{2})=2\sqrt{2}.\hfill \end{array}](https://pressbooks.openedmb.ca/app/uploads/quicklatex/quicklatex.com-d28206e1635cd6727d1b725f6ec294af_l3.png "Rendered by QuickLaTeX.com")
The area of the region is  units 2 .
If R is the region between the graphs of the functions and over the interval ![\ds \left[\pi \text{/}2,2\pi \right],](https://pressbooks.openedmb.ca/app/uploads/quicklatex/quicklatex.com-811a7cdb40a30dfff4f1d53c4cb6b815_l3.png "Rendered by QuickLaTeX.com") find the area of region
find the area of region
Answer
 units 2
Hint
The two curves intersect at 
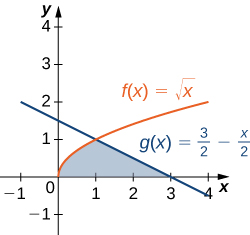
Finding the Area of a Complex Region
Consider the region depicted in the Figure 6 below. Find the area of

Solution
As in the previous example, we need to divide the interval into two pieces. The graphs of the functions intersect at  (set
(set  and solve for
  ), so we evaluate two separate integrals: one over the interval
 ![\ds \left[0,1\right]](https://pressbooks.openedmb.ca/app/uploads/quicklatex/quicklatex.com-604fbdc23306af177dbc3daac90c1cfc_l3.png "Rendered by QuickLaTeX.com") and one over the interval
and one over the interval ![\ds \left[1,2\right].](https://pressbooks.openedmb.ca/app/uploads/quicklatex/quicklatex.com-3e5f11c5c9ea5b24ab6386292e5024e8_l3.png "Rendered by QuickLaTeX.com")
Over the interval ![\ds \left[0,1\right],](https://pressbooks.openedmb.ca/app/uploads/quicklatex/quicklatex.com-963e720c933498269ca86b03d93512d6_l3.png "Rendered by QuickLaTeX.com") the region is bounded above by
the region is bounded above by  and below by the -axis, so we have

Over the interval ![\ds \left[1,2\right],](https://pressbooks.openedmb.ca/app/uploads/quicklatex/quicklatex.com-44bca71b95be2d99fa0ef435a674b504_l3.png "Rendered by QuickLaTeX.com") the region is bounded above by
the region is bounded above by  and below by the
  so we have
![\ds {A}_{2}=\int\limits_{1}^{2}(2-x)\,dx ={\left[2x-\frac{{x}^{2}}{2}\right]}\Big|_{1}^{2}=\frac{1}{2}.](https://pressbooks.openedmb.ca/app/uploads/quicklatex/quicklatex.com-7f82dc54aa9196b5fcbdbfe5f8dd9409_l3.png "Rendered by QuickLaTeX.com")
Adding these areas together, we obtain

The area of the region is  units 2 .
Consider the region depicted in the following figure. Find the area of

Answer
 units 2
Hint
The two curves intersect at 
Regions Defined with Respect to y
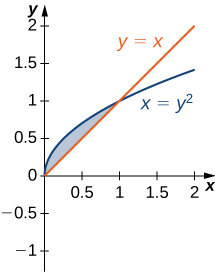
In the previous examples, we had to evaluate two separate integrals to calculate the area of the region. However, there is another approach that requires only one integral. The idea is to rewrite the equations of the curves expressing as a functions of Going back to Figure 6, we note that the left graph, shown in red, is represented by the function  We could just as easily solve this for and represent the curve by the function
  (Note that
  is also a valid representation of the function
  as a function of However, based on the graph, it is clear we are interested in the positive square root.) Similarly, the right graph is represented by the function
  but could just as easily be represented by the function
  When the graphs are represented as functions of
  we see the region is bounded on the left by the graph of one function and on the right by the graph of the other function. Therefore, if we integrate with respect to we need to evaluate one integral only. Let’s develop a formula for this type of integration.
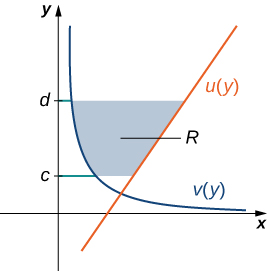
Let  and
and  be continuous functions over an interval
 ![\ds \left[c,d\right]](https://pressbooks.openedmb.ca/app/uploads/quicklatex/quicklatex.com-3f1593cade3889964f5877ebbbd7f562_l3.png "Rendered by QuickLaTeX.com") such that
such that  for all
 ![\ds y\in \left[c,d\right].](https://pressbooks.openedmb.ca/app/uploads/quicklatex/quicklatex.com-6e62ee9a4696a4cd9f78b8f1ae35e652_l3.png "Rendered by QuickLaTeX.com") We want to find the area between the graphs of the functions, as shown in the following figure.
We want to find the area between the graphs of the functions, as shown in the following figure.
 and
and 
This time, we are going to partition the interval on the  and use horizontal rectangles to approximate the area between the functions. So, for let
  be a regular partition of
 ![\ds \left[c,d\right].](https://pressbooks.openedmb.ca/app/uploads/quicklatex/quicklatex.com-5029871ef6256f9be9a0fff49986af8e_l3.png "Rendered by QuickLaTeX.com") Then, for choose a point
Then, for choose a point ![\ds {y}_{i}^{*}\in \left[{y}_{i-1},{y}_{i}\right],](https://pressbooks.openedmb.ca/app/uploads/quicklatex/quicklatex.com-f5ac6e76da241ea9c020589e02f313e4_l3.png "Rendered by QuickLaTeX.com") then over each interval
then over each interval ![\ds \left[{y}_{i-1},{y}_{i}\right]](https://pressbooks.openedmb.ca/app/uploads/quicklatex/quicklatex.com-e110b215b1548054bf786165fad9ec09_l3.png "Rendered by QuickLaTeX.com") construct a rectangle that extends horizontally from
construct a rectangle that extends horizontally from  to
to  Figure (a) below shows the rectangles when
  is selected to be the lower endpoint of the interval and Figure (b) shows a representative rectangle in detail.
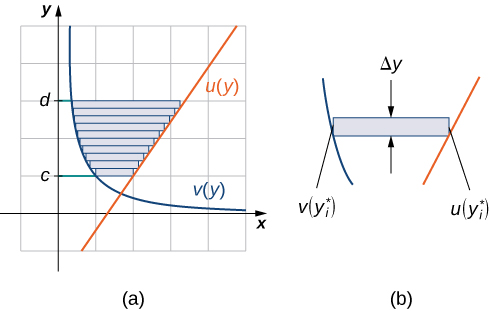 and
and  with rectangles. (b) The area of a typical rectangle.
The height of each individual rectangle is  and the width of each rectangle is
  Therefore, the area between the curves is approximately
![\ds A\approx \underset{i=1}{\overset{n}{\sum}}\left[u({y}_{i}^{*})-v({y}_{i}^{*})\right]\Delta y.](https://pressbooks.openedmb.ca/app/uploads/quicklatex/quicklatex.com-73cd85459bc6291b574c9b3de231da2b_l3.png "Rendered by QuickLaTeX.com")
This is a Riemann sum, so we take the limit as  obtaining
![\ds A=\underset{n\to \infty }{\text{lim}}\underset{i=1}{\overset{n}{\sum}}\left[u({y}_{i}^{*})-v({y}_{i}^{*})\right]\Delta y=\int\limits_{c}^{d}\left[u(y)-v(y)\right]dy.](https://pressbooks.openedmb.ca/app/uploads/quicklatex/quicklatex.com-5384b96f70e1e3e5c03bd9dde65a1cab_l3.png "Rendered by QuickLaTeX.com")
These findings are summarized in the following theorem.
Finding the Area between Two Curves, Integrating along the y-axis
Let and be continuous functions such that for all Let denote the region bounded on the right by the graph of  on the left by the graph of and above and below by the lines
  and
and  respectively. Then, the area of is given by
![\ds A=\int\limits_{c}^{d}\left[u(y)-v(y)\right]dy.](https://pressbooks.openedmb.ca/app/uploads/quicklatex/quicklatex.com-6adc28470707d0438da100194d2dbb78_l3.png "Rendered by QuickLaTeX.com")
Integrating with Respect to y
Let’s revisit the example with the region shown in Figure 6, only this time let’s integrate with respect to Let be the region depicted in below. Find the area of by integrating with respect to
 can be calculated using one integral only when the curves are treated as functions of
 Solution
We must first express the graphs as functions of As we saw at the beginning of this section, the curve on the left can be represented by the function  and the curve on the right can be represented by the function
Now we have to determine the limits of integration. The region is bounded below by the -axis, so the lower limit of integration is  The upper limit of integration is determined by the point where the two graphs intersect, which is the point
  so the upper limit of integration is
  Thus, we have
 ![\ds \left[c,d\right]=\left[0,1\right].](https://pressbooks.openedmb.ca/app/uploads/quicklatex/quicklatex.com-526e2793bab30b2fcf1916d596b2f7db_l3.png "Rendered by QuickLaTeX.com")
Calculating the area of the region, we get
![\ds \begin{array}{cc}\ds \hfill A&\ds =\int\limits_{c}^{d}\left[u(y)-v(y)\right]dy\hfill \\[5mm] &\ds =\int\limits_{0}^{1}\left[(2-y)-\sqrt{y}\right]dy={\left[2y-\frac{{y}^{2}}{2}-\frac{2}{3}{y}^{3\text{/}2}\right]}\Big|_{0}^{1}\hfill \\[5mm] &\ds =\frac{5}{6}.\hfill \end{array}](https://pressbooks.openedmb.ca/app/uploads/quicklatex/quicklatex.com-7331cfb426b21ecc49a7fac767162e70_l3.png "Rendered by QuickLaTeX.com")
The area of the region is units 2 .
Let’s revisit the exercise associated with Figure 7, only this time, let’s integrate with respect to Let be the region depicted in the following figure. Find the area of by integrating with respect to
Answer
units 2
Hint
Follow the process from the previous example.
Key Concepts
- Just as definite integrals can be used to find the area under a curve, they can also be used to find the area between two curves.
- To find the area between two curves defined by functions, integrate the difference of the functions.
- If the graphs of the functions cross, or if the region is complex, use the absolute value of the difference of the functions. In this case, it may be necessary to evaluate two or more integrals and add the results to find the area of the region.
- Sometimes it can be easier to integrate with respect to
 to find the area. The principles are the same regardless of which variable is used as the variable of integration.
Key Equations
- Area between two curves, integrating on the -axis
![\ds A=\int\limits_{a}^{b}\left[f(x)-g(x)\right]\,dx](https://pressbooks.openedmb.ca/app/uploads/quicklatex/quicklatex.com-ab5c36ba45cd1357121936d05571408f_l3.png "Rendered by QuickLaTeX.com")
- Area between two curves, integrating on the -axis
![\ds A=\int\limits_{c}^{d}\left[u(y)-v(y)\right]dy](https://pressbooks.openedmb.ca/app/uploads/quicklatex/quicklatex.com-df7899a5f4651c05a3fc0d3c008a14d1_l3.png "Rendered by QuickLaTeX.com")
Exercises
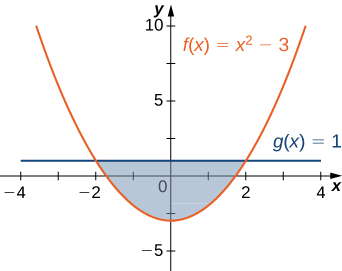
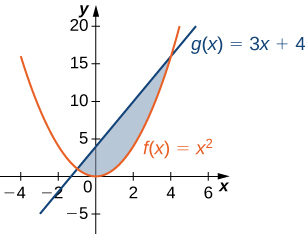
For the following exercises, determine the area of the region between the two curves in the given figure by integrating over the 
1. 
Answer

2. 
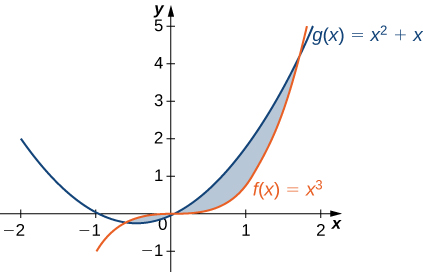
For the following exercises, split the region between the two curves into two smaller regions, then determine the area by integrating over the  Note that you will have two integrals to evaluate.
3.  and
and 
Answer

4.  and
and  for
for 
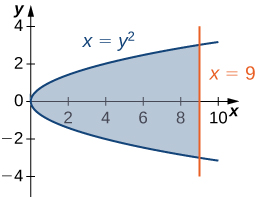
For the following exercises, determine the area of the region between the two curves by integrating over the 
5. 
Answer
36
6. 
For the following exercises, graph the equations and shade the area of the region between the curves. Determine its area by integrating over the
7. 
Answer
 243 square units
8. 
9.  and
and  on
on ![\ds x=\left[-\pi ,\pi \right]](https://pressbooks.openedmb.ca/app/uploads/quicklatex/quicklatex.com-49b70f23a00657097f67c615228895a8_l3.png "Rendered by QuickLaTeX.com") (Hint: use that
(Hint: use that  to sketch the curve.)
Answer
 4
4
10. 
11. 
Answer


12. 
13. 
Answer


For the following exercises, graph the equations and shade the area of the region between the curves. If necessary, break the region into sub-regions to determine its entire area.
14. 
15. 
Answer


16.  and over
17.  over
over ![\ds x=\left[-1,1\right]](https://pressbooks.openedmb.ca/app/uploads/quicklatex/quicklatex.com-4c00ff05c526cfb34fa49f8f80141b72_l3.png "Rendered by QuickLaTeX.com")
Answer


18.  over
over ![\ds x=\left[-1,3\right]](https://pressbooks.openedmb.ca/app/uploads/quicklatex/quicklatex.com-678b1766a8b8d2a5906f76913086c480_l3.png "Rendered by QuickLaTeX.com")
19.  and
and 
Answer


For the following exercises, graph the equations and shade the area of the region between the curves. Determine its area by integrating over the -axis.
20. 
21. 
Answer


22. 
23. 
Answer

24. 
25. 
Answer


For the following exercises, graph the equations and shade the area of the region between the curves. Determine its area by integrating over the -axis or -axis, whichever seems more convenient.
26. 
27.* 
Answer


28. 
29. 
Answer

30. 
31. 
Answer


32. 
33. 
Answer

34. 
35. 
Answer

36. 
37. 
Answer

For the following exercises, find the exact area of the region bounded by the given equations if possible. If you are unable to determine the intersection points analytically, use a calculator to approximate the intersection points with three decimal places and determine the approximate area of the region.
38. [T] 
39. [T] 
Answer
1.067
40. [T] 
41. [T] 
Answer
1.605
42. [T] 
43. [T] 
Answer
7.523
44. [T] 
45. [T] 
Answer

46. [T] 
47. [T] 
Answer
1.429
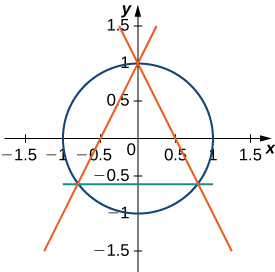
48. The largest triangle with a base on the that fits inside the upper half of the unit circle  is given by
  and
and  See the following figure. What is the area inside the semicircle but outside the triangle?
49. A factory selling cell phones has a marginal cost function  where represents the number of cell phones, and a marginal revenue function given by
  Find the area between the graphs of these curves and
  What does this area represent?
Answer
 total profit for 200 cell phones sold
50. An amusement park has a marginal cost function  where represents the number of tickets sold, and a marginal revenue function given by
  Find the total profit generated when selling 550 tickets. Use a calculator to determine intersection points, if necessary, to two decimal places.
51. The tortoise versus the hare: The speed of the hare is given by the sinusoidal function  whereas the speed of the tortoise is
  where
where  is time measured in hours and the speed is measured in miles per hour. Find the area between the curves from time
  to the first time after one hour when the tortoise and hare are traveling at the same speed. What does it represent? Use a calculator to determine the intersection points, if necessary, accurate to three decimal places.
Answer
3.263 mi represents how far ahead the hare is from the tortoise
52. The tortoise versus the hare: The speed of the hare is given by the sinusoidal function  whereas the speed of the tortoise is
  where is time measured in hours and speed is measured in kilometers per hour. If the race is over in 1 hour, who won the race and by how much? Use a calculator to determine the intersection points, if necessary, accurate to three decimal places.
For the following exercises, find the area between the curves by integrating with respect to and then with respect to Is one method easier than the other? Do you obtain the same answer?
53. 
Answer

54. 
55. 
Answer

For the following exercises, solve using calculus, then check your answer with geometry.
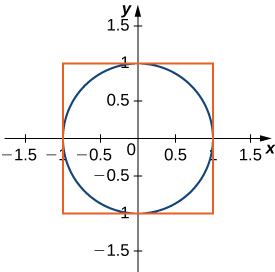
56. Determine the equations for the sides of the square that touches the unit circle on all four sides, as seen in the following figure. Find the area between the perimeter of this square and the unit circle. Is there another way to solve this without using calculus?
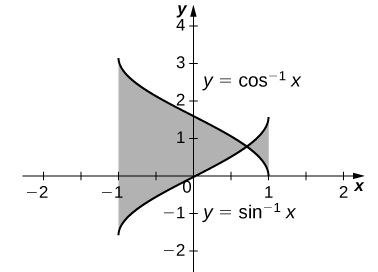
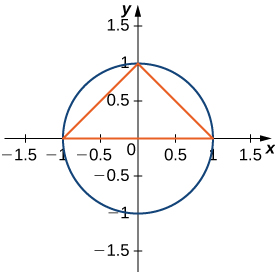
57. Find the area between the perimeter of the unit circle and the triangle created from  and
and  as seen in the following figure. Is there a way to solve this without using calculus?
Answer


Hint
Graph the functions to determine which function’s graph forms the upper bound and which forms the lower bound, then follow the process used in the previous example.