Part 5: Controlling
18. Control
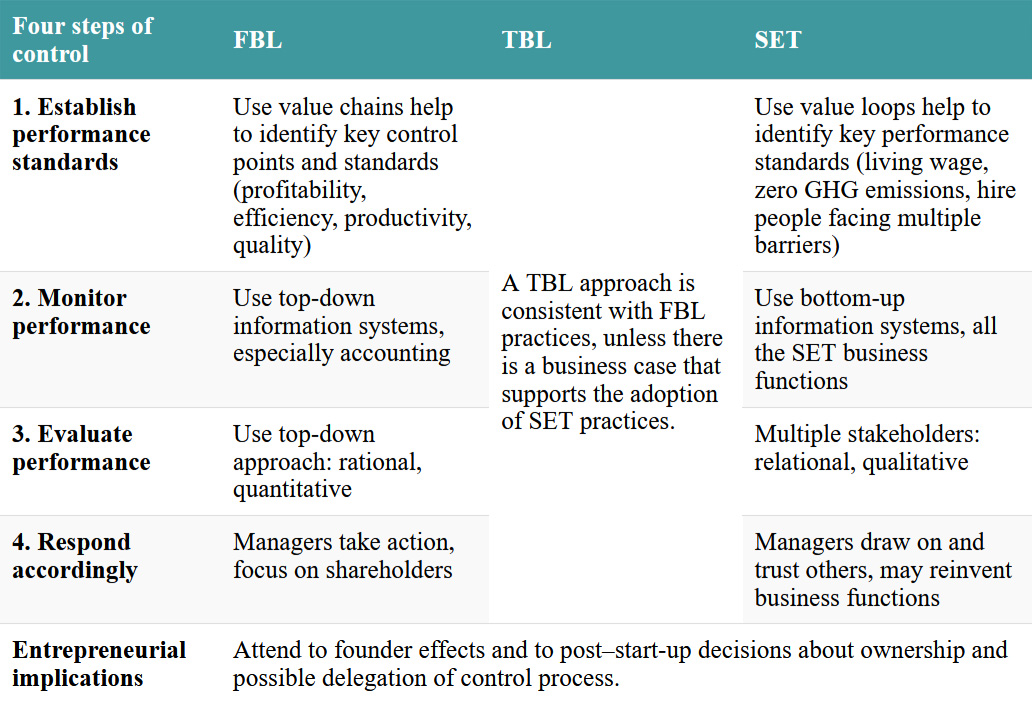
Chapter 18 provides an overview of the four steps of organizational control, as summarized in the following table and in the whiteboard animation video.
Learning Goals
After reading this chapter, you should be able to:
- Outline the purpose of management control and management control systems.
- Understand the components of a value chain and the distinguishing features of a value loop.
- Describe the four-step process of organizational control.
- Explain how the control process varies in FBL, TBL, and SET management.
- Explain the difference between data and information, and why this is key to controlling.
- Explain why entrepreneurs need to consider founder effects and post–start-up decisions about ownership and delegation of control processes.
18.0. Opening Case: Like Father, Unlike Son
Michael Mauws was completing a graduate degree in business when his father, Larry, asked him to manage his company, Westward Industries Ltd.[1] The company designed and manufactured three-wheeled cars used by police forces throughout the United States for traffic control and parking enforcement. Its three-wheeled GO-4 vehicle had taken the market by storm and was a leader in its market segment.
Larry wanted Michael to take over the firm so that Larry could focus on his favorite part of the business, which was redesigning the car and inventing new products. Michael agreed to help his father and had visions of making the company a self-managed organization where workers had as much control as possible.
Michael knew that he and his father had different visions for how Westward should be managed. Larry was an entrepreneur who liked to invent things, but he did not like paperwork. He was always tinkering with the car, improving it because he enjoyed responding to customer feedback. For him, the best way to grow Westward was by improving the design of its product. It was his company, his car, and he called the shots. There were few written policies and a very limited paper trail. Inventory and parts were especially problematic, and often the assembly line had to wait for a rush order of missing parts.
Westward’s employees were happy that the firm was going to be managed by someone with Michael’s administrative and organizational skills, and glad that Larry would stay on as vice-president of research and development. Michael’s management style was the opposite of his father’s. Rather than top-down control, Michael wanted to manage the firm from the bottom up, with members having control over their work. Michael wanted to be treated like a member of the team, a team where everyone in the organization performed their role and respected each other. He wanted everyone to have ownership of their jobs and to enjoy their work. He also wanted everyone to be empowered to make decisions about their jobs, including what time they arrived in the morning and when they left at the end of their shift. After all, they were the experts in the work that they did. Michael created a “What’s Happening” binder that he left on the staffroom table; it contained letters to suppliers and customers, and financial reports. He wanted everyone to know what was going on.[2] Michael started to hold weekly staff meetings, where problems were discussed and decisions made.
Michael’s most important contribution was to overhaul the information systems at Westward. He revamped everything from human resource management to accounting to operations management. He knew that getting the right information into the hands of employees was key to his vision of a self-managed organization. His new systems provided basic information that had not been available at Westward before—like how many parts there were in inventory—and it was welcomed by everyone. At first Larry despised the system, because it demanded that everyone—even Larry—had to account for each part and piece of material being used. Michael also overhauled the accounting system, which made it easier to find out which custom orders were more profitable, what the costs were for adding special features to the vehicle, and which components to produce in house and which to buy from suppliers.
Compared to his entrepreneurial father, Michael had a different set of values and ideas about control, and a different way of relating to others and making decisions. This, in turn, resulted in his developing different information systems. However, even six months after his arrival and making all these changes, most employees at Westward had not embraced Michael’s management approach. They had spent years working under Larry’s approach, and most did not buy into his son’s vision for a self-managed organization.
Then unexpectedly Michael left Westward, and Larry took over the management duties again. Although Larry appreciated the systems improvements that Michael had made, Larry was quick to revert to his “old school” approach to managing the company. And employees, who were very familiar with Larry’s management style, were ready to embrace it. Michael’s vision for a self-managed firm and his changes seemed destined to fail.
However, the story does not end there. One year after his departure, Michael’s idea of a self-managed organization started to take hold at Westward. This happened in large part because of the way that Michael had designed Westward’s management information systems, which Larry had not changed after Michael’s departure. By working in accordance with these information systems—which Michael had created to support his vision of a self-managed organization—workers at Westward began to experience firsthand what Michael had been trying to accomplish. They grew to enjoy the empowerment that the information systems provided.
Gradually employees began to challenge Larry, in large part because Michael’s systems provided them with information to make better decisions than Larry could make. For example, ordering supplies and parts was no longer based on Larry’s guesstimates but rather on the more accurate information provided by Michael’s information systems. In sum, the information systems that Michael had developed and implemented were shaping a self-managed organization, where control that had formerly been held by the manager was now available to workers.
18.1. Introduction
Michael’s efforts to create a self-governing organization and the systems he designed to make this possible in Westward’s accounting, operations, and human resource management functions illustrate the importance of information systems in understanding the control process in organizations. Controlling seeks to ensure that an organization’s activities serve to accomplish its goals. Controlling is usually taught as the fourth function of management (after planning, organizing, and leading). However, at its best, controlling may represent the most thoughtful, reflective, and forward-looking of Fayol’s four functions of management, and could easily be taught before the other management functions. Controlling demands that managers consider the “big picture” of an organization’s operations and ensure that all the different activities accomplish what they set out to do.
As will be described in greater detail in the chapter, this big-picture understanding can be facilitated by thinking about how an organization manages its inputs, its conversion processes, and its outputs. In other words, it involves seeing an organization as a system that interacts with its larger environment (see Chapter 2 on open systems thinking). Managing inputs includes how the organization sources the things it requires to do its work (e.g., hiring employees, securing necessary financing from investors, and procuring resources like energy, raw materials, and other supplies). Managing conversion processes involves turning inputs into outputs, the actual work the organization does to manufacture goods or provide services (e.g., training and motivating workers, managing cash flow, maintaining equipment). And managing outputs refers to all the things that a firm produces (e.g., goods and services for clients, earnings for owners, and waste and pollution). There is a lot to control! Indeed, controlling involves each of the functions of business: supply chain management, human resource management, accounting and finance, operations, and marketing.
In the next section we describe the four-step control process, highlighting differences among the Financial Bottom Line (FBL), Triple Bottom Line (TBL), and Social and Ecological Thought (SET) approaches.
18.2. Four Steps of the Control Process
The four steps of the control process are (1) establish performance standards, (2) monitor performance, (3) evaluate performance, and (4) respond accordingly. This process will unfold somewhat differently for FBL, TBL, and SET managers, but it also will be informed by other factors, especially the organization’s design—simple, defender, prospector, or analyzer type (see Chapter 11). For example, defender organizations favor using written performance standards to control internal organizational operations, whereas prospector organizations lean toward informal performance standards and relationships with external stakeholders. In other words, some organizations emphasize bureaucratic control (e.g., rules, standard operating procedures), others market control (e.g., industry standards and benchmarks), and others clan control (e.g., organizational values and culture).[3]
18.2.1. Step 1: Establish Performance Standards
Because managers cannot control everything that happens in an organization, they must be selective when they design control systems. In the first step of the control process, managers identify the most important activities that need to be controlled. This involves developing a short list of key performance standards that serve as indicators of whether a firm is meeting its overall goals (i.e., its mission, vision, and strategy; see Chapter 8). Recall from Chapter 9 that performance standards refer to metrics used to determine how well a particular employee, department, or organization is doing its work.
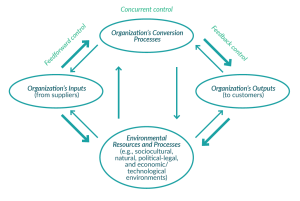
Developing an organization’s key performance standards can be challenging. To meet this challenge, managers have found it helpful to consider three dimensions of organizational activities that managers must control, as shown in Figure 18.1. Inputs (e.g., hiring employees with needed skills, acquiring adequate financing, accessing supplies, etc.) provide resources that are combined in a conversion process (e.g., manufacturing) to produce outputs (e.g., goods and services) for specific markets that the organization serves. This value chain—the sequence of activities needed to convert an organization’s inputs into outputs—is a crucial tool that helps managers choose key performance standards. Value chains help managers design control systems by identifying critical factors that determine whether goals are met, and anticipating major problems such as waste,[4] over-production, and defects.[5]
Figure 18.1. A conventional value chain

Figure 18.1 includes three important mechanisms of control—feedforward, concurrent, and feedback—that are connected to the three steps of the value chain. First, managers need to determine the inputs required for their organization to create its goods and services. Feedforward control is designed to determine whether an organization’s inputs meet its performance standards. Feedforward control helps an organization’s operations to run smoothly and to identify potential problems related to inadequate inputs. It allows managers to reduce problems from occurring by anticipating and preventing them. For example, managers ensure that the people they hire have proper training and experience, that the financing they acquire is affordable and legitimate, and that the raw materials come from trustworthy suppliers and are available in a timely manner. Feedforward control will often draw from and be related to an organization’s supply chain function (sourcing inputs), human resource management function ( hiring practices), and finance function (ensuring adequate funding).
Concurrent control is designed to determine whether an organization’s conversion processes meet its performance standards. This helps managers to ensure operations meet expected quality metrics and to identify and correct problems as they occur. This might include things like ensuring employees are provided with and follow standard operating procedures, adequate cash flow to meet operational needs, and quality control. Concurrent control will often draw from and be related to an organization’s human resource management function (training practices, compensation), and accounting function (production costs), and operations management (quality control).
Feedback control is designed to determine whether an organization’s outputs meet its performance standards. This might include performing exit interviews with employees who leave the organization, ensuring the return rate on financial investments meets targets, and monitoring customer satisfaction and sales for trends and surprises. Feedback control will often draw from and be related to an organization’s supply chain management (delivery), and finance and accounting function (profit margin), and marketing function (customer satisfaction). If performance standards are not met, then corrective action can be taken to avoid future problems.
To illustrate how these controls work together across the organization, imagine that you manage a business that manufactures medical devices. Your control system needs to ensure that the devices meet technical, operational, and safety performance standards. This requires establishing performance standards and feedforward control related to inputs (e.g., to ensure that suppliers follow stringent quality control; that all raw materials are traceable, and a recall system is in place to identify which products need to be removed from the market in case of problems related to suppliers). It also requires developing concurrent control related to the conversion process (e.g., to ensure that products meet technical specifications; that staff have proper training in and follow safety standards). And finally, it means requires developing feedback control related to output (e.g., packaging materials are not contaminated; shipping occurs under proper environmental conditions, including temperature and humidity; once received by customer, products are inspected for possible damage during shipping and tested prior to use).[6]
Despite the merits and extensive use of value chains within FBL management, they are increasingly being replaced by ideas like value loops, which are related to cradle-to-cradle thinking (see Chapter 4)[7] and the circular economy—that is, an economy that is regenerative and restorative and where so-called waste is transformed into valuable inputs.[8] A value loop describes how an organization’s inputs are converted into outputs, which in turn are linked to the organization’s future inputs. Like a value chain, the value loop concept depicts the organization as an open system in relationship with its external environment, but expands considerably the scope of the external environment (see Figure 18.2). Adding a fourth node—“Environmental Resources and Processes”—to value chains, value loops draw attention to social and ecological externalities associated with inputs and outputs. Value loops help managers understand how organizational activities contribute to and resolve social and ecological problems in the larger system. “Completing the circle” from outputs to inputs also adds meaning to the nature of feedforward, concurrent, and feedback control.
Figure 18.2. A generic value loop
Whereas value chains move in only one direction (i.e., from inputs to conversion processes to outputs[9]), value loops explicitly recognize that the flow of resources travels in both directions between the nodes. The thicker arrows in Figure 18.2 indicate the direction that managers usually see the resources flowing, while the thinner arrows indicate that managers must also be sensitive to how resources and information flow in the opposite direction. These “opposite direction” flows affect the control process. For example, when managers in fast food restaurants began to receive unsolicited requests for food prepared in a healthier fashion (i.e., grilled not fried, fruit instead of fries, veggies instead of meat), this affected the companies’ conversion processes. Customer inquiries regarding the environmental impact of packaging influenced managers’ input decisions (such as looking for suppliers who used recycled paper). Managers have much to gain by developing control systems that adapt to changes in customer preferences or trends in the larger environment.
Consider how value loops are evident at Interface Inc., the carpet manufacturer described in the opening case of Chapter 13, which went from being an FBL- to a TBL- and eventually a SET-managed company.[10] In particular, we will focus on the different subcomponents within the “Environmental Resources and Processes” circle at the bottom of Figure 18.2 and briefly describe how each is related to Interface’s inputs, conversion process, and outputs. In terms of the natural environment, Interface uses natural materials as inputs, and at the same time its managers strive to minimize the amount of pollution or waste it creates and to maximize the reusability of its outputs (e.g., cradle-to-cradle product design). In terms of the socio-cultural environment, managers at Interface recognize that societal values shape their employees and provide the legitimacy that allows the company to do its work (inputs), and Interface contributes to the socio-cultural environment by creating jobs and products that provide symbolic and social meaning (outputs). Interface also affects the socio-cultural environment by providing a compelling example of how SET management principles can be applied in large organizations. In terms of the political-legal environment, managers at Interface depend on the legal institutions and regulations that allow it to exist as a corporation (inputs), and it in turn provides taxes to support the infrastructure created and maintained by government (outputs). Finally, in terms of the economic and technological environments, Interface requires investment capital and existing technology (inputs), and it pays out dividends and develops more sustainable technologies that create benefits for others (outputs).
FBL, TBL, and SET Approaches to Establishing Performance Standards
As we described above, managers draw from the various functions of business when developing performance standards. For example, feedforward control may often draw from supply chain management, concurrent control will draw from production and operations, and feedback control from marketing. Even so, the nature of the performance standards managers develop will vary based on management approach.
Of the three approaches to management, FBL management is the most likely to emphasize controls that can be quantified and written down, and is known for placing particular emphasis on performance standards rooted in accounting.[11] From an FBL perspective this makes sense, insofar as accounting tends to measure things in financial terms.
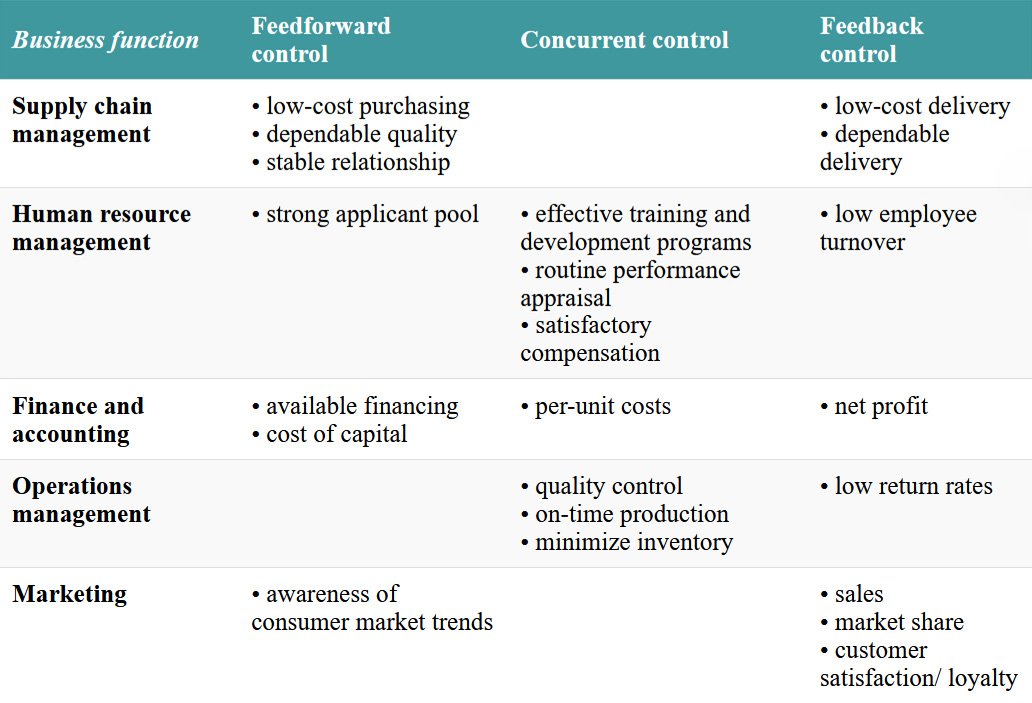
This emphasis on measuring the financial performance of a firm is evident in the illustrative standards shown in Table 18.1. For example, when it comes to feedforward control, FBL managers seek low-cost suppliers (to reduce expenses), dependable quality (to minimize unexpected costs), stable relationships with suppliers (to reduce the expenses associated with switching from one supplier to another), a strong applicant pool (to reduce search costs related to recruitment), and access to low-cost financing (low interest costs). Similarly, when it comes to concurrent control, FBL managers seek training and development programs that minimize costs while ensuring employees are adequately trained, and standardized performance and compensation practices that are efficient. Finally, FBL managers are also particularly interested in the financial implications of feedback controls.
Table 18.1. Illustrative FBL performance standards from select business functions
TBL managers use many of the same performance standards associated with FBL management, but in situations where it is in their financial interests to do so, they also include standards more closely associated with SET management that consider social and ecological factors and link an organization’s outputs and inputs (see in Table 18.2). This is consistent with TBL management’s emphasis on reducing negative externalities when there is a business case to do so. A TBL approach is evident in many tools being used in the field, including variations of ESG (economic, social, and governance) reporting, the balanced scorecard approach, and social and ecological audits.[12]
A SET approach also uses performance standards associated with FBL and TBL approaches, but rather than concentrating on maximizing financial interests, efficiency, and achieving competitive advantage, a SET perspective is more likely to prioritize things like interpersonal trust, the flow of empowering information, and enhanced ecological well-being. This is not to say that SET management ignores the kinds of performance standards listed in Table 18.1, but rather that compared to FBL and TBL managers, SET managers place more emphasis on the kinds of performance standards shown in Table 18.2.
Table 18.2. Illustrative SET performance standards
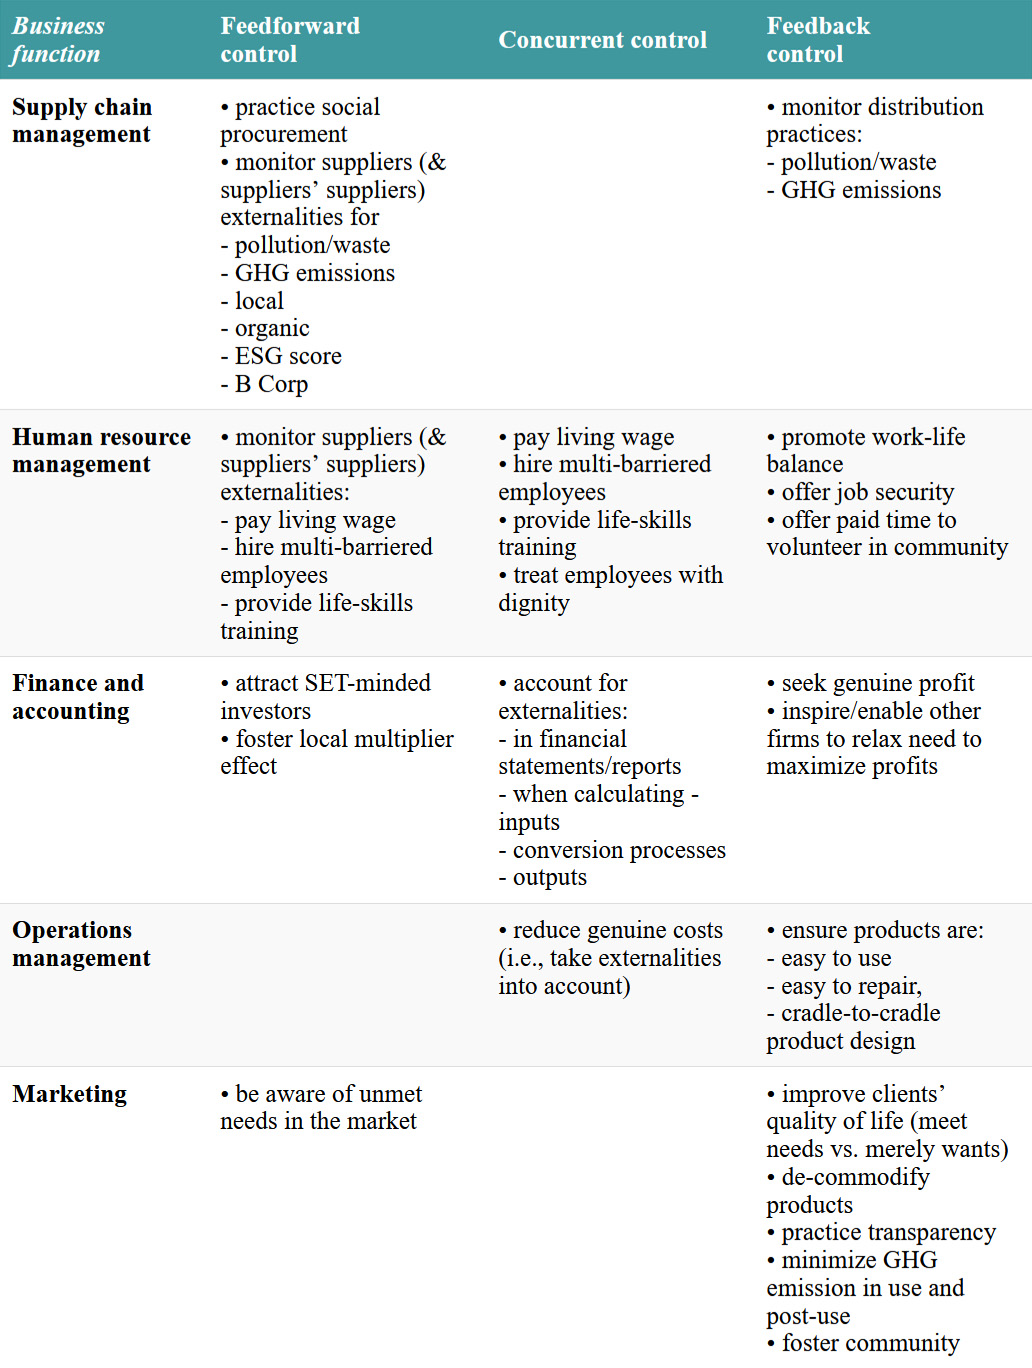
Note that Table 18.2 also contains feedforward and feedback controls which, from an FBL value chain perspective may seem unnecessary and impossibly complicated. However, some of these previously “unnecessary” considerations are already being included in practice and regulations. For example, consider the performance standard related to measuring GHG (greenhouse gas) emissions through the entire supply chain. This sounds challenging. Yet this is a challenge worth accepting from a SET perspective. And this view seems to be gaining momentum. From 2025 onward, large corporations doing business in Europe have to report on their Scope 3 emissions,[13] which include GHG emissions related to transportation (including transport of raw materials, business travel, employee commuting), production and use of the outputs (including those of customers and disposal of products), and even from the investments a firm makes (e.g., whether it invests in fossil fuel companies or in regenerative agriculture companies).[14] Moreover, Scope 3 emissions include not only those of a firm’s suppliers but also of its suppliers’ suppliers.[15] In other words, if Company A buys electricity from Company B, and Company B bought the electricity from Company C who produced it by burning coal, then Company A’s Scope 3 report must include the GHGs emitted by Company C. “Organizations’ supply chains emissions are, on average, 11.4 times higher than operational emissions, which equates to approximately 92 percent of an organization’s total GHG emissions.”[16]
Note that some important SET performance standards may be challenging to quantify, such as treating people with dignity, developing mutual trust and community, and enhancing biodiversity. This difficulty is consistent with SET performance standards being based on SMART 2.0 rather than SMART principles (see Chapter 9). Following a SET approach, the development and meaning of performance standards are often fleshed out by organization members and other stakeholders rather than by managers imposing standards on others.
For example, recall the lack of written regulations and performance standards at Semco (Chapter 10), including not having a written mission statement, though Ricardo Semler did have a mission: “to find a gratifying way of spending your life doing something you like that is useful and fills a need.”[17] For Semler, productivity and the financial bottom line are a means—obviously an important means—to achieve this larger end.[18] One reason for Semco’s lack of a formal mission statement was Semler’s desire for Semco’s mission, and its key values, to be constantly socially (re)created by the workers and other stakeholders. Inviting a variety of stakeholders (owners, members, customers, suppliers, and neighbors) to participate in shaping an organization’s “barometers of success” is another hallmark of SET management.[19] As Semler noted: “By evaluating success from everyone’s point of view, we believe we’ll land on the new list of companies that unite sustainability with all-around satisfaction. Let’s call this list the Fortunate 500. . . . Redesigning the workplace for the twenty-first century means letting in fresh air and giving up control.”[20]
Test Your Knowledge
18.2.2. Step 2: Monitor Performance
Once managers understand their organization as an open system and have located critical steps in its value chain or loop that enable identification of key performance standards, they must develop appropriate information systems to monitor performance. An organization’s information system consists of its mechanisms that identify, collect, organize, and disseminate information. Information systems are important for each of Fayol’s four functions of management: planning, organizing, leading and controlling. Spending on information technology accounts for more than half of all the money organizations spend on capital annually (over $1 trillion).[21] Information systems are important in each phase of the control process, but perhaps most evident in allowing managers to monitor performance.
Perhaps the most important attribute of information systems is that they determine what is valuable information and what are merely data (see also Chapter 17 on filtering which messages to communicate). Data are facts and figures, some of which managers deem useful but the majority are not. Organizations are filled with almost infinite amounts of data, including what clothes people are wearing on a particular day, what they are eating for lunch, how many words are used in email messages, the tone of someone’s voice, the color of the ceiling, and so on. Most data are ignored because they are not seen as important enough to pay attention to.
Information refers to data that have been given meaning and value. Managers design control and information systems to monitor meaningful data. For FBL and TBL management, meaningful data are those that help to maximize productivity and financial well-being, and thus are deemed to be information. Data that do not help to achieve these goals are not considered information from an FBL perspective. For example, for many years managers at fast food restaurants found that data about the price of paper used to wrap their burgers provided useful information (to allow managers to reduce costs and thus increase profits), but these managers did not have any interest in whether the paper was recycled. Today, thanks to changes in consumer demand, information about whether the paper has been recycled is recognized as valuable information along with the price of the paper.
It is precisely this process of deciding which data are meaningful that makes information systems an essential part of the controlling function. By creating an organization’s information system, managers are signaling what is meaningful and valued in the organization and what is not. For example, FBL managers may design information systems that monitor and collect financial data, but they typically pay much less attention to social and ecological well-being.
Fortunately, managers do not typically need to develop information systems “from scratch” in this second step of the control process. Rather, because performance standards (first step of control process) are related to the different business functions, systems may already be available for managers to use. For example, the human resources department may already collect data on how many hires were facing multiple barriers, how many employees are earning below a living wage, and how often and why employees leave the firm. And the supply chain department may already be collecting information about the hiring practices, working conditions, and GHG emissions of suppliers. Of course, if information about some of these performance standards is not already being collected, then an important part of the control process is to identify the relevant data as important information and request that it start being collected. And once it is collected, managers and employees throughout the organization will give it more attention. This matter is discussed further in step four of the control process.
Again, remember that just because you have data about something does not mean that it is a source of valuable information. Advanced computing systems are at the heart of most control systems in larger-scale organizations, something Henri Fayol could not have envisioned a century ago when he first introduced this management function. We live in a time of supercomputers and “big data,”[22] and managers have an overwhelming amount of data available to them.[23] In this technologically driven era, there is great need to develop information systems judiciously, to minimize “noise” and focus attention on the information that really matters (see Chapter 17).
FBL, TBL and SET Approaches to Monitoring Performance
Compared to SET and TBL approaches, FBL management pays the most focused attention to information that helps maximize productivity, efficiency, and financial well-being. It also places the greatest emphasis on top-down control systems. FBL management favors the efficiencies associated with digital information systems, which enable and thus often encourage monitoring performance using quantifiable information. For example, transaction processing systems are used to record customer orders, track purchases from suppliers, and so on. Most organizations use transaction processing systems to manage tasks like customer billing, supplier payment, and payroll preparation and payment.[24] Grocery stores use scanners to record the sale of items and track inventory levels. The information collected with transaction processing systems is often used in operations information systems, where software helps managers to monitor and coordinate the flow of work between various organizational subunits and their suppliers. Such systems help to identify and overcome potential bottlenecks, shortages in inventory, and overproduction. The information drawn from transaction processing systems is also helpful in decision support systems that allow managers to gather and manipulate data from a variety of sources to help evaluate performance. For example, managers might want to examine past sales data considering seasonality and the timing of new product introductions by competitors to learn how much these factors influence performance. Finally, managers may access and purchase information about customers (and employees) from social media giants like Facebook and Instagram, and monitor what people say online, what purchases they make, and maybe even what they talk about when Apple’s virtual assistant Siri is eavesdropping.[25] TBL management is attracted to the same efficiencies as FBL management, while being more aware of the need to regard some socio-ecological data as information, and using less of a top-down approach in situations where it is profitable to do so.
SET management is more aware of the possible negative effects of using information systems to monitor people. This may be especially relevant in a post-COVID era, as more employees are working from home and use of surveillance tools is increasing (an estimated 60 percent of businesses with remote workers use software to monitor employee’s performance).[26] Whereas tech companies suggest that monitoring employees’ mouse movements, keyboard strokes, and website histories will make them more productive, loyal, happy, collaborative and innovative, experience suggests the practice can lower trust and dehumanize the workplace, reduce autonomy and dignity, increase resentment, and create other negative social externalities that undermine productivity.[27]
A SET approach is particularly aware that members treat one another more respectfully when there are no monitoring systems.[28] For example, Semco—which places primary emphasis on nurturing trust, dignity, and information sharing—does not set up structures and systems like internal audits or inspections to monitor whether workers are complying with organizational regulations (though they must comply with governmental regulations). A SET approach is most likely to design management information systems that empower workers. Ricardo Semler believes that information is power, and he does not want to use that power as a form of hierarchical control. Instead, Semco favors a transparent information system where, for example, everyone has access to the company’s financial books (including company profits and every employee’s salary), which are also open for audit by their unions. This willingness to share information also spills over to Semco’s external environment, such as occasions where customers are sometimes told exactly how much profit Semco will earn from a given sale.
Although SET companies like Velo (Chapter 9) and Semco deliberately minimize many aspects of traditional top-down performance monitoring (e.g., Semco monitors profits and inventories but does not monitor the performance or hours worked by individual employees), they do use bottom-up performance monitoring systems. Semco employees annually fill out an anonymous survey about the company, its future, and its managers. Every six months members fill out a “Seen from Below” questionnaire that asks thirty-six questions, such as whether a manager treats subordinates and peers in the same way.[29]
It should come as no surprise that the SET approach requires the transformation of information systems associated with traditional business functions, in part because SET management monitors the widest scope of socio-ecological performance. This may be most evident in the accounting function. Recall that accounting systems focus on the financial activities going on within the boundaries of an organization. This may be why Max Weber identified accounting as the key to enabling FBL capitalism. From an FBL accounting perspective, a firm is encouraged to not provide benefits to its employees, to export manufacturing overseas to exploit lower labor costs, and to build factories in countries where pollution laws are not enforced. These actions reduce the financial expenses of the firm (and thus increase profits) by increasing the externalities paid by others (e.g., for medical expenses, poverty, and pollution). Indeed, far from being a neutral approach to measuring performance, accounting is set up in a way that contributes to an increasing gap between rich and poor. The rich (the few who can afford shares in corporations) gain when the corporations they own create negative externalities for the rest of the world. Recall from Chapter 1 that the largest 1,200 corporations created $5 trillion of negative ecological externalities in 2018 (a 50 percent increase from five years earlier),[30] an amount greater than their total profits. From an accounting perspective, a firm’s profits increase the more it can offload its expenses to others.
Of course, accounting can be reinvented to have firms measure their social and ecological externalities. For example, assume that a loaf of bread at Tall Grass Prairie Bread Company costs $6.00 and that a similar loaf at Factory Bakery costs $5.00. Let’s further assume that the Tall Grass loaf is made with local, organic flour, that Tall Grass hires multi-barriered employees and pays them a living wage, and that Factory Bakery does none of these things. If we calculate the financial value of the positive effect on externalities associated with Tall Grass practices (e.g., lower cancer rate due to reduced use of pesticides, reduced recidivism, increased soil health, benefits of local multiplier effect) it amounts to a benefit of at least $2.00 per loaf. In other words, if you included the value of externalities in the bread from Factory Bakery, it would cost $7 per loaf. Which loaf would you purchase? Would you like such information to be available for all the items you purchase (e.g., the externalities embedded in imported vs. local vegetables, in a regular vs. an electric car, in different pairs of jeans, and so on)?[31]
Test Your Knowledge
18.2.3. Step 3: Evaluate Performance
In this step, managers compare the information collected in the second step (monitoring performance) to the goals or standards established in the first step (establishing standards). This allows managers to answer questions such as: Have quality standards been met? Is the “liquidity ratio” within the desired range? Are inventory levels acceptable? Have our GHG emissions decreased? Have we contributed to a sense of community in the neighborhood we operate in? Have we decreased the gap between rich and poor?
While carrying out this step, managers must decide whether extenuating circumstances help to explain variations in performance. For example, did a competitor introduce a new product, or go bankrupt? Were there unforeseen shifts in the industry, or in the overall economic picture? Were any employees experiencing health problems that affected their performance?
Managers must also understand where the variation in performance is a factor of the systems people are working in, and not just a result of the effort or competency of the workers themselves. This is another reason it is important for controlling to be rooted in an understanding of the organization’s key systems. Perhaps the best example of this comes from Total Quality Management (TQM), which emphasizes how managers can continuously improve organizational work systems so that products and services better meet the quality desired by customers.[32] This is illustrated by the “Red Bead Experiment” that W. Edwards Deming, a founding father of the quality movement, often used at his four-day seminars.[33] In the experiment, ten volunteers are recruited to work in an “organization” that includes six workers, two inspectors, an inspector of the inspectors, and one recorder. The experimenter then pours 3,000 white beads and 750 red beads into a box (a 4:1 ratio), where they mix together. Each worker scoops beads out of the box with a scoop that holds fifty beads. Each full scoop is considered a day’s production: white beads are acceptable, but red beads are defects. Workers are asked to scoop out only white beads and no red beds. Of course, due to the laws of statistical variability, each worker scoops out some red beads (on average ten beads), regardless of how motivated they are to get only white beads or how much their “manager” exhorts them not to or praises workers who scoop fewer-than-average red beads.
The message of the experiment is simple. From a statistical point of view, it is foolish for a manager to utilize data about the number of red beads any particular worker produces as the only information for evaluating performance. Statistically speaking, there will always be variation in any process or system, so there will always be variations in the performance of workers, with some performing well and others performing not as well. Put differently, there will be differences in individual workers’ performances because performance is often influenced by systemic factors outside a worker’s control. It is therefore up to management to improve the systems rather than to evaluate workers’ performance using standards that have random variation inherently built into them.[34]
FBL, TBL, and SET Approaches to Evaluating Performance
FBL managers are most likely to measure performance standard relaying on quantitative metrics, assuming that numbers don’t lie. They are also more likely to consider financial measures, and to evaluate the performance of individuals more than of groups. This is evident in piece-rate compensation systems, where employees are paid based on how many widgets they produce or by how many sales they make, by giving “employee of the month” awards to top performers, by paying bonuses to employees who meet certain targets, and so on (see also Chapter 14).
Because of their greater attention to larger systems (e.g., value loops over value chains), TBL and SET managers are more likely to recognize that the performance of individuals is often influenced by systemic factors outside of their control. TBL and SET managers extend TQM ideas by applying them to ecological, political-legal, and socio-cultural systems evident in value loops. For example, TBL managers often evaluate performance based on ESG measures, which include evaluating things like GHG emissions and the number of people with diverse backgrounds on their boards. And while strong ESG scores have been related to profitability, unfortunately they often become “box-checking” exercises that do not move the needle much on sustainability.[35]
A SET approach relaxes the emphasis on maximizing financial well-being (which reduces its need for ESG-washing), is more likely to consider qualitative evaluations, and involves more stakeholders in evaluating performance. An example of the latter is evident when an organization’s annual report includes social audits prepared by external evaluators, when managers are evaluated by the people who report to them, and when external stakeholders are invited to participate in decision-making processes. A SET approach will place greater emphasis on evaluating performance holistically, and is consistent with intelligent product systems that evaluate organizational performance more positively when organizations adopt cradle-to-cradle processes that minimize waste (see Chapter 4).
Overall, SET management places greater emphasis on relational and qualitative measures of performance (SMART 2.0 goals) than on the rational and quantifiable measures associated with the FBL approach (SMART goals). One reason that FBL management is so popular is because of its emphasis on rational and objectively measurable goals like productivity and profits, which seem comparatively easy to measure in monetary terms. It appears more difficult to monitor or evaluate SET goals like trust, ecological biodiversity, social justice, and so on. However, upon closer inspection the so-called rational financial measures that characterize FBL management may be less objective than people think, or they may measure things that people don’t see as important to them. A company’s annual report has the appearance of objectivity and reality, but numbers and reports are poor representations of the human, intellectual, social, and spiritual capital that make up an organization. And even a measure as basic and seemingly non-controversial as “profit” can be manipulated, as evident in the case of the British chemical company ICI, when top management deliberately changed how it calculated and reported the company’s profits to show the company’s first loss in 100 years. That “loss” was designed to get the attention and support of employees to implement a transformational change that top management thought the company needed.[36]
Test Your Knowledge
18.2.4. Step 4: Respond Accordingly
Responding accordingly is an ongoing activity that can happen during any step in the control process, and it provides feedback information to the control process. For example, if input standards are not being met, then it may be time to reconsider suppliers. If the conversion process standards or output standards are not being met, it may mean offering training or professional development to correct the behavior or transferring staff to other jobs that they are more capable of handling. In short, responding accordingly serves as a feedback loop in the control process, and describes how managers use information provided by the control process to improve an organization’s operational systems and activities.
Sometimes responding accordingly may prompt managers to reconsider an organization’s entire value chain or cycle, which would trigger the organizational change process described in Chapter 13. As is evident in the opening case of this chapter, it may take a long time before comprehensive changes to an organization’s information or control systems result in noticeable changes in members’ worldviews or performance. Unfortunately, it is not unusual for managers to become disappointed when changes they have implemented do not immediately yield the improvements they had hoped for; this may cause them to become impatient and jump from one fad to another. Indeed, expected performance improvement may take three or more years to materialize, and it is therefore important that changes are not implemented on an ad hoc or piecemeal basis. Thus, to respond accordingly may mean that managers must be patient and ensure that their approach to control is implemented consistently throughout the organization and in all four steps of the control process.[37]
FBL, TBL, and SET Approaches to Responding Accordingly
FBL managers are most likely to focus narrowly on whether a firm’s financial performance standards are being met, and to take a short-term, financially driven, unilateral, top-down approach to responding accordingly. FBL managers are famous for so-called rank and yank systems, where employees are ranked from highest to lowest performing, and responding accordingly means firing the lowest-performing employees or closing the least-profitable division or business. For example, former General Electric CEO Jack Welch was infamous for shutting down divisions were profitable but not profitable enough (i.e., they were not in the top three of their industries), with little regard for socio-ecological consequences.[38]
Compared to managers following an FBL approach, TBL and SET managers give more attention to sustainable development, and on a relational, multilateral, bottom-up approach to responding accordingly whenever these enhance an organization’s financial well-being.[39] When TBL managers encounter inadequate performance, they are more likely than FBL managers to seek help from others to understand why it occurred and to develop a way to resolve the problem. Rather than assume that problems must be solved from the top down, TBL managers often take a more relational approach that welcomes bottom-up input. Because TBL and SET managers treat stakeholders with respect and foster community when it is profitable to do so, stakeholders often have a greater interest in helping to solve organizational problems.[40]
SET management places an even greater emphasis on socio-ecological well-being and on having members get involved in responding accordingly when performance standards are not met.[41] This is consistent with designing information systems that empower the members, as in this chapter’s opening case featuring Westward Industries. Ricardo Semler has often been asked: “How do you control a system like the one at Semco?” He answers: “I don’t. I let the system work for itself.”[42] Trust was threatened at Semco when equipment theft started to be a problem in the workplace, but then resolved itself without intervention from management (see Chapter 16).
As evident at Interface, Westward, and Semco, sometimes responding accordingly means wholesale change across a firm’s business functions. For example, new requirements for firms to report Scope 3 emissions demand a transformational change in the accounting function, which will need to consider externalities related to GHG emissions. This in turn will demand transformational change in supply chain management (which will need to collect information about GHG emissions associated with suppliers), operations management (which will need to collect information about GHG emissions associated with operations), and marketing (which will need to collect information about GHG emissions associated with use and disposal of a firm’s products). All this will in turn change what an organization’s business functions focus on and value in the decisions managers make.
While we cannot describe a SET approach to each of the business functions (which would take more than one book), the end-of-chapter appendix suggests in broad brushstrokes the key difference between FBL and SET approaches to supply chain management, human resource management, accounting, finance, operations management and marketing. The challenge facing Michael Mauws in the opening case was to design SET-minded information systems for Westward’s business functions. And you may face similar challenges in your career as businesses increasingly play their part in enhancing social and ecological well-being, relaxing the pursuit of profit maximization for those who can afford shares. Best wishes!
Test Your Knowledge
18.3. Control in Entrepreneurship
As we noted at the start of the chapter, the control process plays a vital role in every aspect of managing an organization. It is relevant for entrepreneurs, who from the beginning need to be thinking about issues such as their value chain or loop, performance standards, and information systems. Therefore, the all the information in this chapter is directly applicable to entrepreneurs. However, there are two additional considerations distinctive to entrepreneurship that can influence the control process: founder effects in the start-up phase, and long-term involvement and goals of entrepreneurs in the post–start-up phase.
Founder Effects
Entrepreneurs who start organizations are referred to as founders, and the specific qualities of founders can have important and long-lasting effects on their organizations’ control processes.[43] The chapter’s opening case discussion of Westward Industries highlights these founder effects: Michael Mauws, the new CEO, had trouble changing operations because members were more familiar with the old way of operating under the founding CEO, Larry Mauws. Even if Michael’s new ideas were “better,” members tended to stick with the old ways because they were familiar and “normal” (consistent with the discussion of organizational social scripts in Chapter 2).[44] Founder effects are an example of organizational imprinting, which is the tendency for organizations to take on qualities that reflect conditions when they were founded and to continue displaying those qualities after the founding stage.[45] Because of imprinting, idiosyncrasies of an organization’s founder(s) are often reflected in the organization’s culture, strategy, and control process even after decades after the departure of the founder.[46]
The power of founder effects has important implications for entrepreneurs. Those starting new organizations should think carefully about the practices they create and use. A behavior that is “good enough for right now” may become institutionalized and resistant to change in the future. In particular, the control systems that entrepreneurs use in the early days can come to define what is normal for far longer than the entrepreneur may wish. Interface Inc. is an example of an organization that was able to change from an FBL to a SET management approach (Chapter 13), but such changes are difficult even if led by the founder. The way an organization operates influences who is a member, both in terms of who is hired and who remains. People who like the current ways of working and succeed under them will remain, while those who do not will leave. In addition, time and use will turn the current ways of working into habits. As a result, most organizational members will resist change, because doing something new leads to uncertainty and possible loss (recall also discussion of threat-rigidity response in Chapter 13). Indeed, even outside parties tend to contribute to the strength of founder effects. For example, firms receive more support from external investors when led by their founder than when led by someone else.[47]
Entrepreneurial Ownership, Goals, and Involvement
Entrepreneurs who retain ownership beyond the start-up phase influence how the organization’s control processes are managed in the longer term. This continuing influence draws attention to the question of entrepreneurs’ interest in and competence to manage the organization once it is operating and facing its post–start-up challenges. Recall that organizations typically develop in a predictable sequence that takes them from a simple organizational design to a defender design (Chapter 13). This change often involves becoming more mechanistic in structure, with jobs becoming more narrowly specialized, rules becoming more formalized, and many other changes that reduce the free-form operation of a simple start-up. The managerial skill set required for these two organization designs is different in important ways.
Some entrepreneurs enjoy the start-up phase of establishing an organization’s operations and demonstrating its promise but, like Larry Mauws, have little interest in developing the information systems to take the organization to the next step. As Michael noted, “Larry was more interested in building a car than in building an organization.” A micropreneur may be content with a small organization that does not need to have formal, well-developed control processes. In comparison, a serial entrepreneur may know that they are good at and enjoy the start-up phase, and once its operations have been established and shown to be viable, they are happy to sell the firm to someone who has the skills to develop information systems and control processes to take it to the next level. And a monopreneur may have or develop the necessary skills themselves to design and implement the information systems and control processes to take a firm to the next level, or hire someone else with the necessary skills to do so (e.g., someone like Michael Mauws). However, it is not unusual for start-ups to fail when entrepreneurs lack the required skills to develop adequate control processes but are unwilling to cede control to someone else.
When entrepreneurs consider what sorts of control processes should be developed, it is important for them to think about their long-term aspirations for the organization. Do they want to grow the firm as large as possible to maximize potential financial returns (a classic FBL approach)? This is sometimes called “scaling up,”[48] and has metaphorically been likened to “going viral.” Or is the goal to optimize social and ecological well-being by developing relationships with stakeholders to take increasingly better care of the natural environment and foster healthy communities (aligned with a SET approach)? This is sometimes called “scaling deep” and likened to “growing like an oak tree” (deeply rooted in place, providing resilience and resources to the ecosystem surrounding it). Research suggests that start-ups that go viral may provide higher financial returns to investors, but oak trees are better for enriching the surrounding community.[49] The scaling deep approach is evident in Tall Grass Prairie Bread Company, which started by sourcing only local organic flour but over time developed relationships with farmers to grow and provide other local organic grains, and then eventually encouraged and supported the start-up of like-minded bakeries that also source local organic flour.
When entrepreneurs do give up ownership control of an organization, they enable the new owners to manage its control processes. The transfer between founding and new owners is the final opportunity for owners to imprint their legacy on control processes. The transactional approach of FBL entrepreneurs who seek to maximize their financial gain from a sale may increase the likelihood that the organization is purchased by equally transaction-minded investors who prefer FBL control systems. In the FBL approach, selling a start-up is called harvesting, which is withdrawing one’s financial investment (i.e., ownership) in an organization with the intent of achieving financial gain by doing so. Harvesting is also common for TBL entrepreneurs, who also aim to maximize their financial gains from having owned the organization. Start-ups can be sold to larger firms, or perhaps through an Initial Public Offering (IPO), which involves the selling of ownership shares on a public securities exchange for the first time (see Chapter 17).
In contrast, SET entrepreneurs may be more interested in ensuring their organizations remains SET-oriented after they sell. As a result, the typical SET approach is better reflected by seeding, which is transferring one’s ownership to new owners with the intent of facilitating further socio-ecological well-being. For example, some organizations use employee stock ownership plans to transfer control of the organization from the founder to the members. In these plans—as part of retirement contributions, bonus programs, or profit-sharing—the current owner’s stocks are transferred to employees. Cora Wiens, an entrepreneur who was the founding owner of Eadha Bakery in Winnipeg, Manitoba, eventually created a workers’ co-operative to own the bakery.[50] And in 2022 Patagonia’s co-founders, Yvon and Malinda Chouinard, and their two children, donated ownership of the multi-billion company to a trust to oversee its mission and values (2 percent) and to a nonprofit organization (98 percent) that “will use every dollar received to fight the environmental crisis, protect nature and biodiversity, and support thriving communities.”[51] Imagine the effect this will have an effect on the performance standards in Patagonia’s control processes going forward, versus selling the firm to a fast fashion giant.
Test Your Knowledge
Chapter Summary
- Organizations are open systems that interact continuously with the external environment:
- (i) Value chains illustrate these interactions as a three-step process by which businesses produce valued goods and services: inputs ® conversion ® outputs.
- (ii) Value loops extend the model by adding a fourth step that completes the cycle, incorporating the environmental resources and processes upon which businesses depend, and considering the dynamic flows between four system parts.
- In the FBL approach to the four-step control process, managers do the following:
- (i) Establish key organizational performance standards related to financial performance by understanding the overall value chain, and identifying the key activities and outcomes that need to be monitored.
- (ii) Monitor performance by developing top-down information systems to measure the key performance standards.
- (iii) Evaluate performance, remembering that organizational systems themselves may be a cause of poor performance.
- (iv) Respond accordingly using a top-down, rational process.
- In the TBL approach to the four-step control process, managers rely on FBL practices and, in situations where it is in their financial interests to do so, they work with key stakeholders to do the following:
- (i) Establish key organizational performance standards, balancing triple bottom line performance measures by understanding the overall value loop, and identifying the key activities and processes that need to be monitored.
- (ii) Monitor performance by developing information systems to measure the key performance standards.
- (iii) Evaluate performance, remembering that organizational systems and how they interact with socio-ecological systems may be a cause of poor performance.
- (iv) Respond accordingly using a multilateral, bottom-up approach.
- In the SET approach to the four-step control process, managers work with stakeholders to do the following:
- (i) Establish key organizational performance standards with a focus on enhancing socio-ecological well-being by understanding the overall value loop, and identifying the key activities and processes that need to be monitored.
- (ii) Monitor performance by developing bottom-up information systems to measure the key performance standards.
- (iii) Evaluate performance, remembering that organizational systems and how they interact with socio-ecological systems may be a cause of poor performance.
- (iv) Respond accordingly using a multilateral, bottom-up approach, where members often make needed changes on their own.
- Entrepreneurial start-ups need control systems just as any other organization does. Attempts to implement appropriate changes to the initial systems as the organization matures can be difficult because of founder effects and the founder’s ability and desire to manage the organization once it moves past the start-up phase.
Questions for Reflection and Discussion
- Draw a value loop that describes a key economic transaction in your personal life (e.g., purchasing food, transportation, clothing, etc.).
- Consider the following statement: “Because value chains are simpler than value loops, and because managers opt for the simplest cause-and-effect relationships that are relevant, learning about value loops is of little interest to most managers.” Do you agree or disagree with the statement? Explain your reasoning.
- Describe the four steps of the control process. Compare and contrast the managerial actions and assumptions that are evident in FBL, TBL, and SET approaches for each of the four steps in the process.
- What is the difference between data and information? Describe a situation at an organization that you know about where what were formerly data are now treated as valuable pieces of information. Can you think of the reverse situation, that is, where information has become data? Explain your answer.
- Describe the difference between feedforward, concurrent, and feedback control. What are the management challenges associated with each?
- Now that you have read the chapter, consider again the opening case. Why was were employees unwilling to change their views about how Westward was managed while Michael Mauws was CEO, but hanged their views after he left? What might this tell us about the importance of information systems versus the importance of leadership?
- Consider the following statement: “Thanks to computer-based technology there is a de-emphasis on things that are difficult to measure quantifiably, such as compassion, empathy, meaningful work, aesthetic beauty, and neighborliness. As a result, higher-order virtues and noble goals like peace, love, joy, prudence, wisdom, and so on have also been de-emphasized. Because these ideas are difficult to measure with computer-based information systems, they are not included in the category of meaningful information in organizations. When we do not look into the eyes of workers on the shop floor in low-income countries we miss out on a whole lot of meaning, and our information systems have failed us.” Do you agree or disagree with the statement? Explain your reasoning.
- Through the course of this book you may have been developing an ESUP (Entrepreneurial Start-Up Plan) for an organization you might like to create. Based on your work in previous chapters, design the control systems for this potential organization. What performance standards will you use? How will you monitor them and evaluate them? What is your plan for responding when those standards are not being met? Explain your answers.
18.4. Appendix
18.4.1. FBL, TBL, and SET Approaches to the Functions of Business
This appendix provides a brief overview of FBL, TBL, and SET approaches to the main functions of business: human resource management, supply chain management, accounting, finance, operations management, and marketing. Before briefly describing each of these functions in turn, we begin with an overview of how they are related to the inputs ® conversion ® outputs framework that underpins the control process. As shown in Figure 18.3, some functions are more related to inputs, others to the conversion process, others to outputs, while some overlap two or more of these.
Figure 18.3. Business functions across the value chain/loop
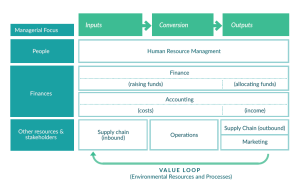
Note also that Figure 18.3 indicates how the business functions relate to different parts of the value chain for three main areas of managerial concern: people, finances, and other resources and stakeholders.[52] Human resource management (HRM) concerns the people aspect of the business, ensuring that organizations are well-staffed, that members are well-trained and motivated to do their work, and adequately compensated. HRM supports employees across the entire value chain. Finance also works across the organization, ensuring sufficient funds are available (inputs) and that funds are allocated prudently to capital projects and operational needs (conversion process, outputs). Accounting is the organization’s financial measurement system used to track expenses (inputs, conversion) and income (outputs) across the entire organization. Supply chain management (SCM) facilitates the sourcing and distribution of material resources in the organization (inputs) and the movement of finished goods out of it (outputs), and often involves coordinating a complex global network of suppliers and customers. Operations management attends to the internal production mechanisms that turn resources into goods and services (conversion process). Finally, marketing aims to ensure that the organization’s goods and services are valued and well-received by customers (outputs).
For convenience, and because the functions naturally pertain to the internal aspects of the organization, Figure 18.3 tends to foreground the value chain conception. The value loop arrow linking outputs to inputs is our visual reminder of the continuous, back-and-forth flows taking place between all aspects of the organization and its environment in this complex, open system. It is also important to recognize that this graphic is a stylized representation of where the functions fit. In reality, the boundaries between the functional areas are not so well-defined, and there is considerable overlap and integration between functions. This should not be a surprise, because all the pieces (functions) work together to create a unified whole (the organization).
18.4.2. Human Resource Management
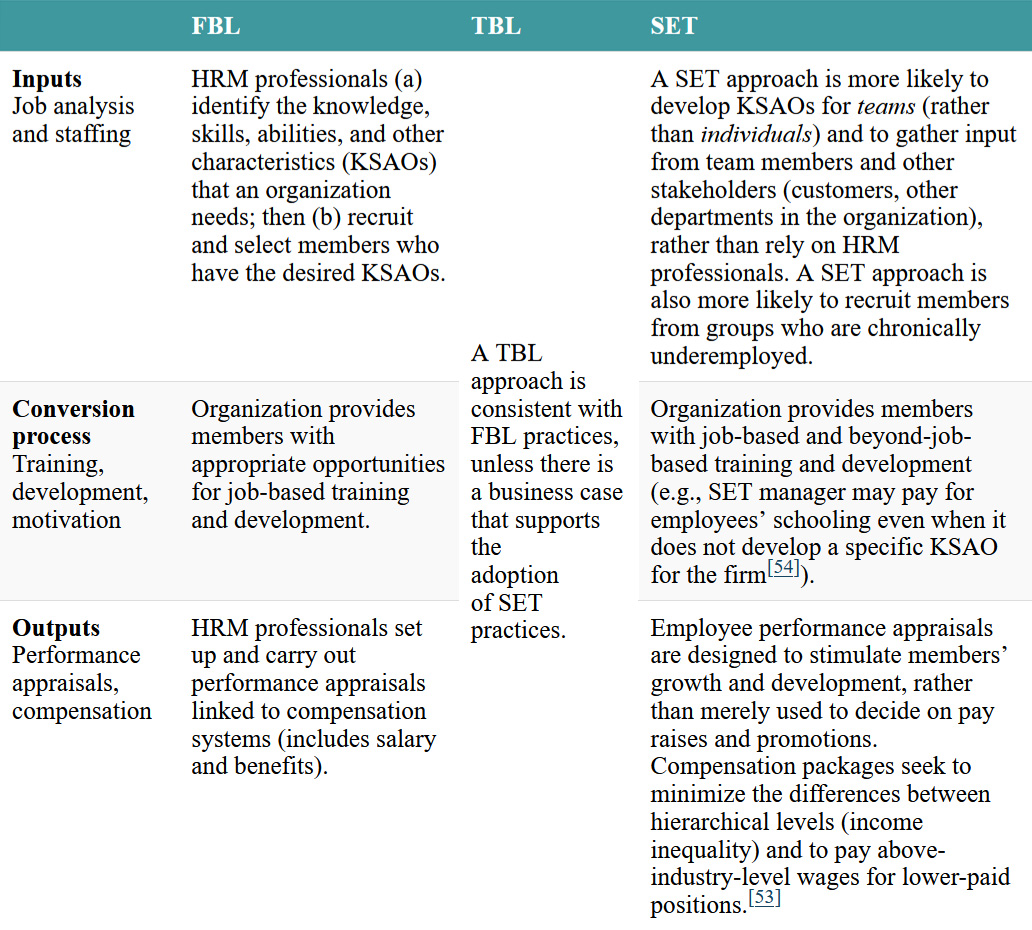
As described in Chapter 12, HRM information systems help managers hire members (inputs), train and motivate them (conversion process), and compensate them (outputs). Table 18.3 provides a brief overview of how these three key steps in HRM differ between FBL, TBL, and SET approaches.
Table 18.3. Comparison of approaches to primary human resource management activities
18.4.3. Finance
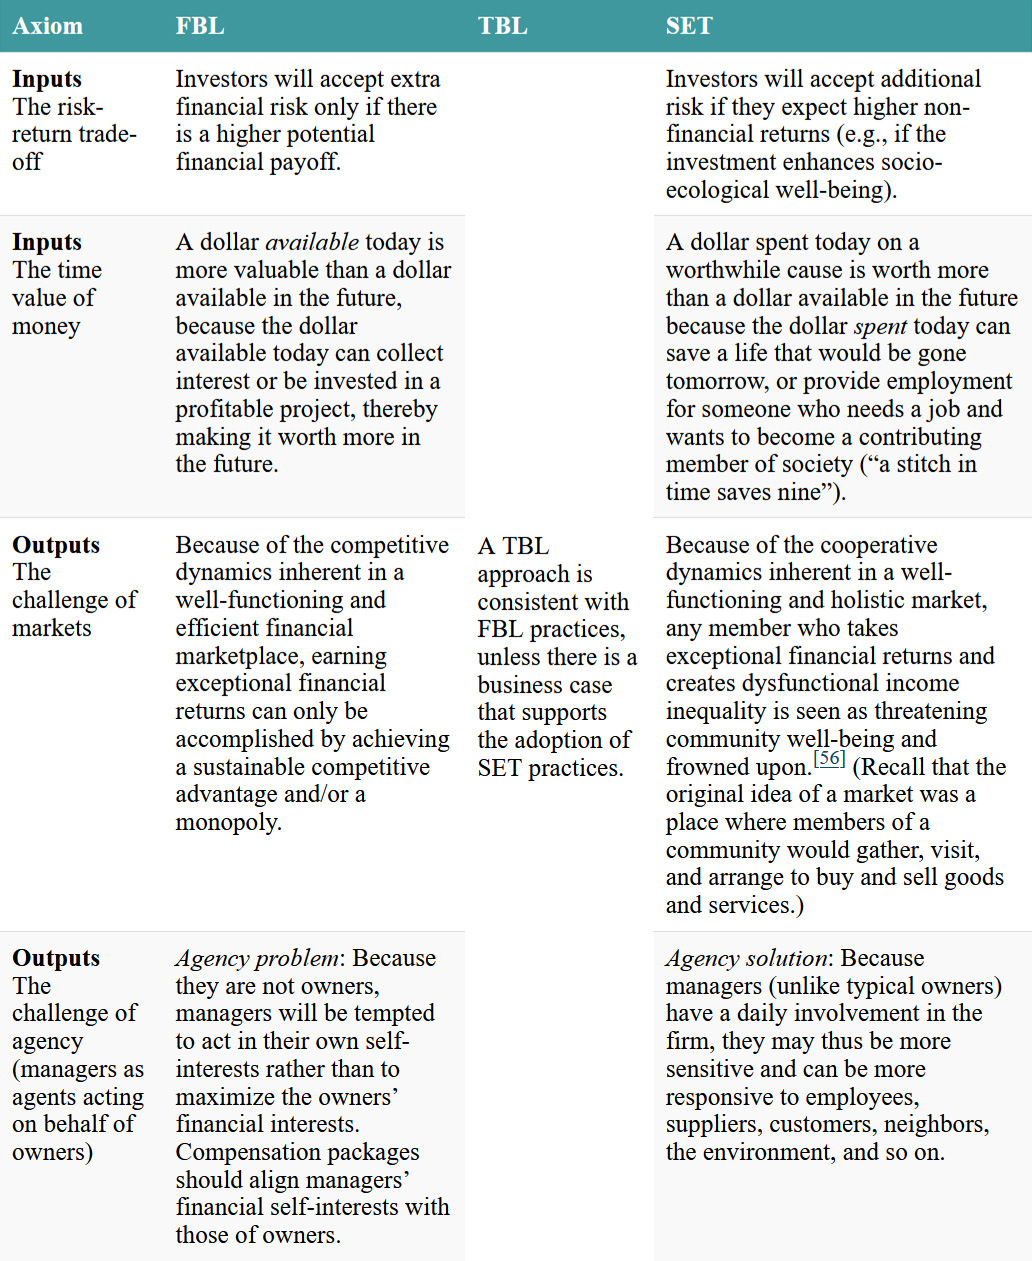
The business function of finance addresses the financial resource needs of the organization. This involves acquiring, allocating, and, in larger firms, investing funds. With regard to acquiring funds (i.e., raising money), there are two basic options: debt financing (a firm borrows money) and equity financing (a firm sells ownership shares to investors). The type of financing chosen is determined in part by the firm’s short-term and long-term monetary needs. With regard to investing money, financial managers look at issues of risk, return, and diversification. Table 18.4 compares FBL, TBL, and SET approaches to the four axioms of finance.[55]
Table 18.4. Comparison of approaches to the four axioms of finance
Note: [56]
18.4.4. Accounting
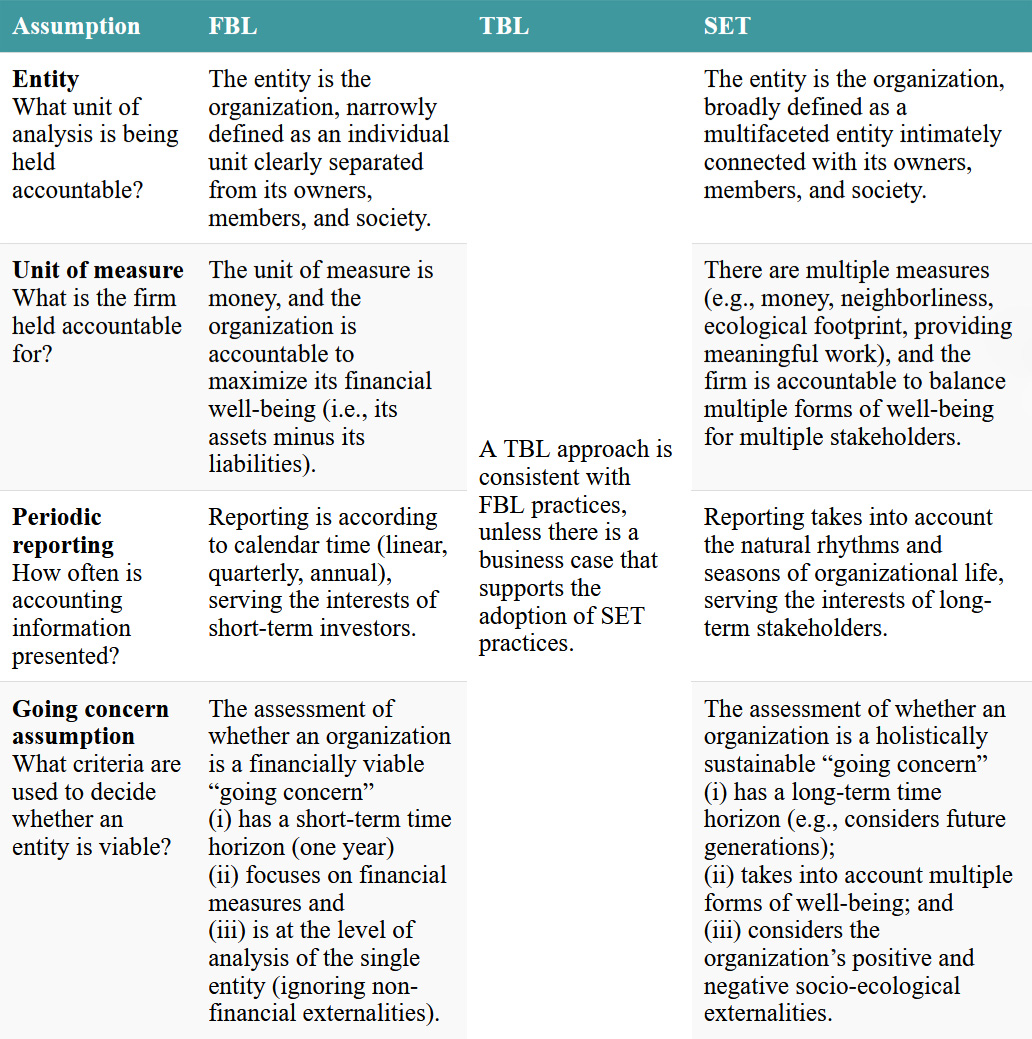
Accounting systems collect, analyze, and communicate information about an organization’s activities in financial terms. Most business schools offer two basic accounting courses: (1) managerial accounting, which supports managers’ internal decision-making by making financially relevant information readily available to them (e.g., the cost of different parts or services, the cost of keeping inventory in stock); and (2) financial accounting, which provides financial reports (profit-loss statements, balance sheets) about the company as a whole to shareholders and the general public. A helpful way to compare managerial approaches to accounting is to consider the fundamental assumptions each makes about accounting. Table 18.5 shows the four assumptions that underpin what are known as generally accepted accounting principles (GAAP). GAAP provides the basis for accounting standards at national and international levels.[57]
Table 18.5. Comparison of approaches to basic assumptions underpinning GAAP
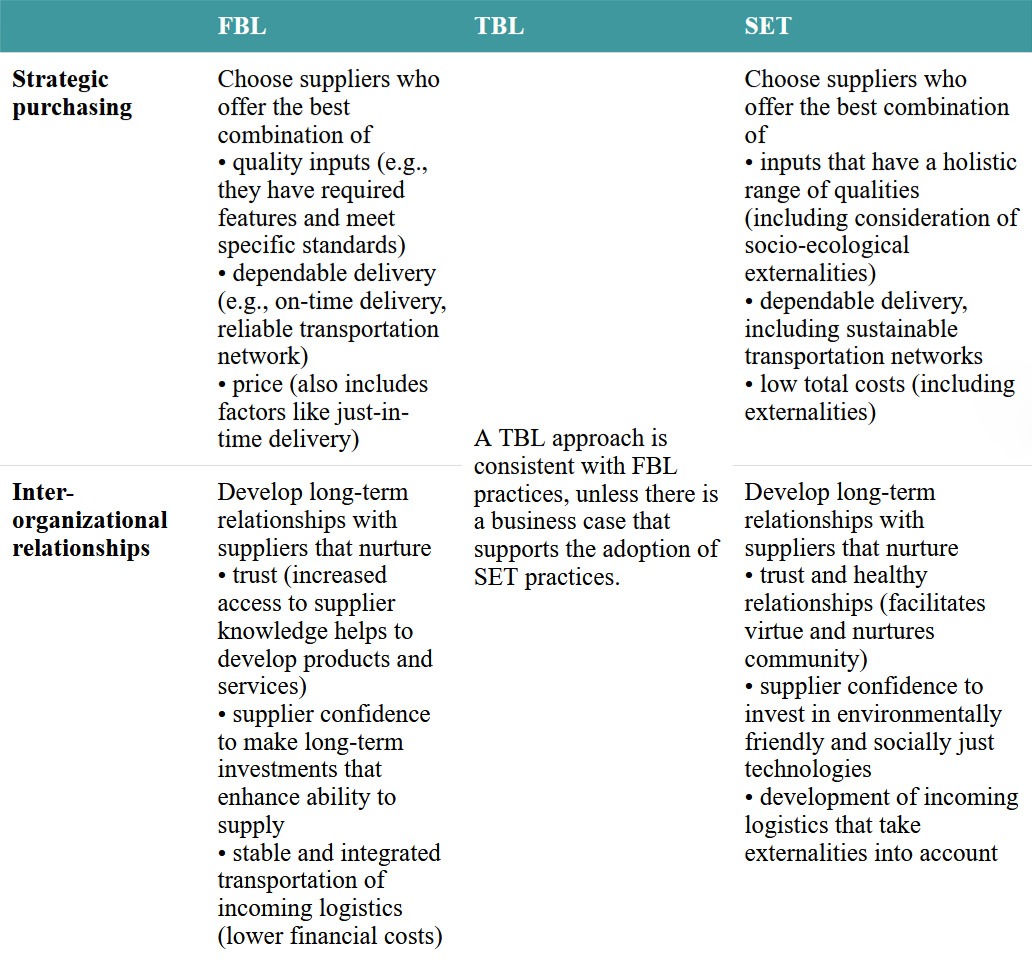
18.4.5. Supply Chain Management
Supply chain management (SCM) traditionally focuses on the flow of material resources into the organization, which requires networking and coordination with external suppliers. It is common for resources to pass through a number of suppliers before arriving at the firm, hence a supply chain. In the modern business environment, many firms exist somewhere in the middle of a globally integrated supply chain, and SCM also facilities the outflow of goods to the next entity in the chain, which may or may not be the final customer. Primary SCM activities include strategic purchasing (supplier selection, evaluation, and development; single vs. multiple sourcing) and the management of interorganizational relationships (e.g., supplier partnerships).[58] A comparison of these activities is provided in Table 18.6.[59]
Table 18.6. Comparison of approaches to primary supply chain management activities
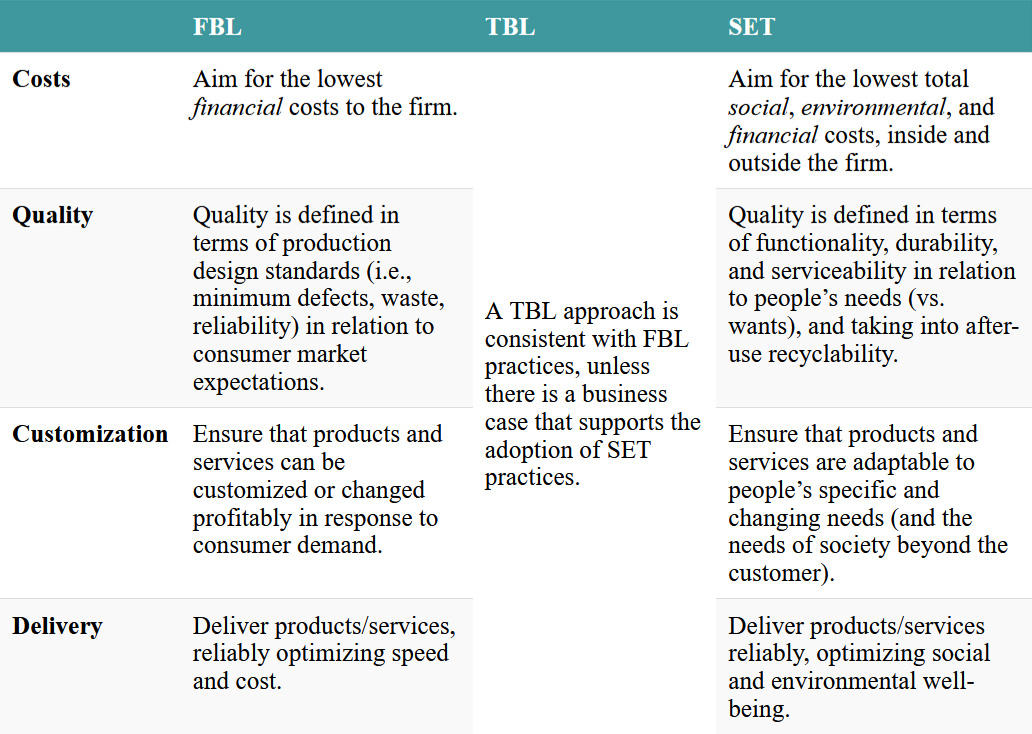
18.4.6. Operations Management
Operations management is at the heart of the conversion process and encompasses the technologies and processes that transform raw materials (inputs) into finished goods and services (outputs).[60] In general, FBL operations will be optimized to maximize efficiency and minimize costs internal to the firm. The quality of goods and services is likewise optimized to maintain continuous and profitable revenue streams through practices such as planned obsolescence. By contrast, SET operations aim to meet people’s needs in ways that holistically optimize long-term social and environmental well-being, both inside and outside the firm. The quality of goods and services is likewise optimized for functional longevity at lowest total social-environmental cost, through practices such as cradle-to-cradle design and service or maintenance programs. Table 18.7 provides a comparison of four key dimensions of operations management: costs, quality, customization, and delivery.
Table 18.7. Comparison of approaches to the four dimensions of operations management
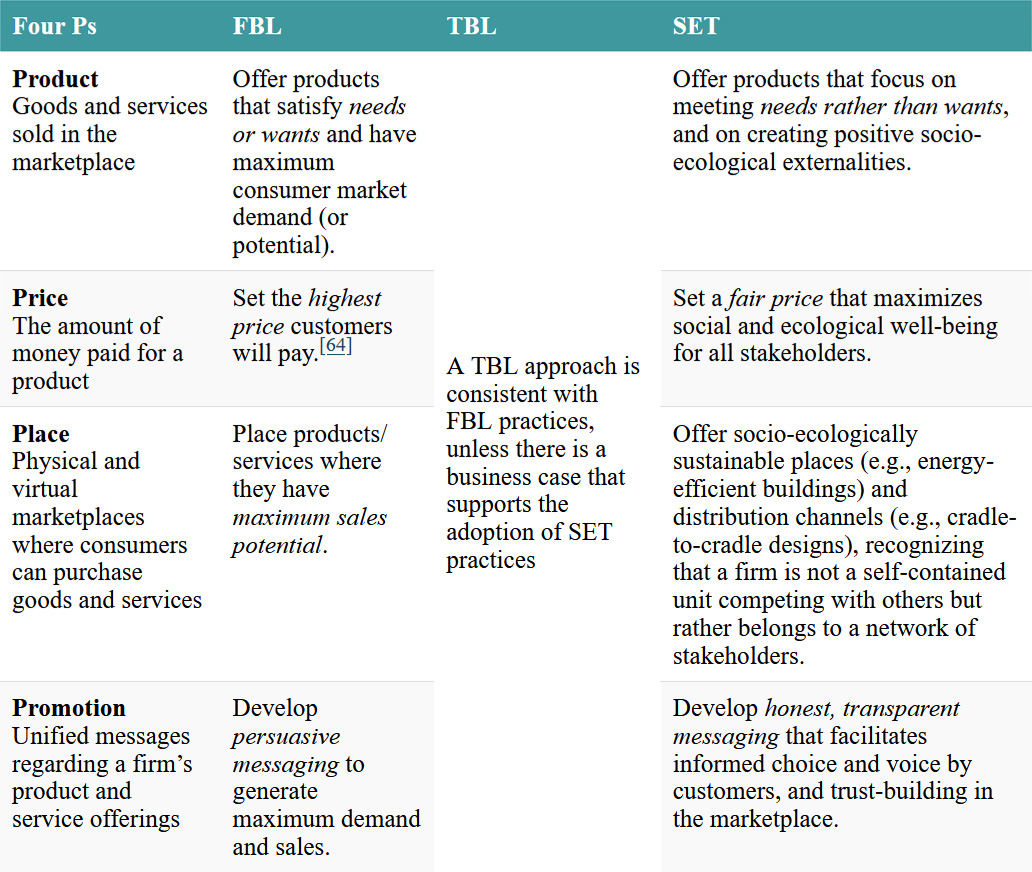
18.4.7. Marketing
Marketing establishes information systems related to the communication (promotion), distribution (place), exchange (price), and offerings (products and services) that have value for customers, buyers, clients, partners, and the overall society.[61] The marketing function has been famously broken down into four elements called the four P’s of marketing: product, price, place, and promotion.[62] As described in Table 18.8,[63] the way these four P’s are understood and managed differs between FBL, TBL, and SET approaches. FBL management is more likely to view (1) product as a self-contained commodity an organization offers (rather than the relationships embedded in the product); (2) price as the financial price paid by the consumer (rather than the costs and benefits borne by the rest of society); (3) place as finding a competitive position in the marketplace (rather than finding a position that fosters mutual cooperation in society); and (4) promotion as actions that help to sell the product (rather than to learn from others and thus offer products that essentially sell themselves).
Table 18.8. Three approaches to the four P’s of marketing
Note: [64]
- This case is based on the lead authors’ observations and research. Some of the details have been altered, and it is offered for pedagogical purposes only. Starke, F. A., Sharma, G., Mauws, M. K., Dyck, B. & Dass, P. (2011). Exploring archetypal change: The importance of leadership and its substitutes. Journal of Organizational Change Management, 24(1): 29–50. https://doi.org/10.1108/09534811111102274; Dyck, B., Starke, F., Mischke, G. & Mauws, M. (2008). Designing and producing a three-wheeled car: An exploratory examination of intra-organizational knowledge flows. Journal of Small Business & Entrepreneurship, 21(1): 37–58; Mischke, G. A., Mauws, M. K., Starke, F. & Dyck, B. (2001). Westward Industries Ltd. Case Research Journal, 21(1): 15-42. ↵
- Michael also developed a profit-sharing plan, where some of the profits were to be spent in ways that benefited everyone in the firm as a group (e.g., a staff benefits program) and another portion to benefit the outside community (e.g., a play structure for a nearby playground). ↵
- Ouchi, W. (1980). Markets, bureaucracies, and clans. Administrative Science Quarterly, 25(1):129–141. http://doi.org/10.2307/2392231; Mosmann, P. C., & Klutt, J. (2020). Market, hierarchy, or clan? Types of governance in the sharing economy. In In I. Maurer, J. Mair, & A. Oberg (Eds.), Theorizing the sharing economy: Variety and trajectories of new forms of organizing (pp. 25–54). Emerald. https://doi.org/10.1108/S0733-558X20200000066003; Powell, W. (1990). Neither markets nor hierarchy: Network forms of organization. In Research in Organizational Behavior, 12: 295–336. https://www.researchgate.net/publication/301840604_Neither_Market_Nor_Hierarchy_Network_Forms_of_Organization ↵
- Manos, T. (2006). Value stream mapping: An introduction. Quality Progress, 39(6): 64–69. ↵
- Bhasin, S., & Burcher, P. (2006). Lean viewed as a philosophy. Journal of Manufacturing Technology Management, 17(1): 56–72. http://doi.org/10.1108/17410380610639506 ↵
- This example draws from and elaborates Rooney, J. J. (2001). 7 steps to improved safety for medical devices. Quality Progress, 34(9): 33–41. ↵
- McDonough, W., & Braungart, M. (2010). Cradle to cradle: Remaking the way we make things. North Point Press; Hoang, K.-M., & Böckel, A. (2024). Cradle-to-cradle business model tool: Innovating circular business models for startups. Journal of Cleaner Production, 467: 142949. https://doi.org/10.1016/j.jclepro.2024.142949 ↵
- This is a simplified definition; the circular economy has been notoriously difficult to define, with many definitions being used. Abu-Bakar, H., Charnley, F., Hopkinson, P., & Morasae, E. K. (2024). Towards a typological framework for circular economy roadmaps: A comprehensive analysis of global adoption strategies. Journal of Cleaner Production, 434: 140066. http://doi.org/10.1016/j.jclepro.2023.140066 ↵
- For an interesting history of how and why things unfolded this way within management theory and practice, see Sheer, S. A. (2005). From supply-chain management to value network advocacy: Implications for e-supply chains. Supply Chain Management, 10(2): 77–83. https://www.researchgate.net/ ↵
- For additional information on Interface, see Anderson, R. C. (1998). Mid-course correction: Toward a sustainable enterprise: The Interface model. Peregrinzilla Press. ↵
- For example, textbooks sometimes place accounting and controlling in the same chapter, including Laasch, O. (2024). Principles of business and responsible management: Practicing ethics, responsibility, sustainability. (3rd ed.). Sage. ↵
- Tawse, A., & Tabesh, P. (2023). Thirty years with the balanced scorecard: What we have learned. Business Horizons, 66(1): 123–132. http://doi.org/10.1016/j.bushor.2022.03.005; Kaplan, R., & Norton, D. (1996). The balanced scorecard. Harvard Business School Press; Kaplan, R., & Norton, D. (2006). How to implement a new strategy without disrupting your organization. Harvard Business Review, 84(3): 100; Chopra, S. S., Senadheera, S. S., Dissanayake, P. D., Withana, P. A., Chib, R., Rhee, J. H., & Ok, Y. S. (2024). Navigating the challenges of environmental, social, and governance (ESG) reporting: The path to broader sustainable development. Sustainability, 16(2): 606. http://doi.org/10.3390/su16020606 ↵
- “In the EU, large, listed companies need to begin reporting in 2025 under CSRD [Corporate Sustainability Reporting Directive]. In the US, California mandates Scope 3 reporting for any company operating in the state with more than billion in annual revenue.” Aligned Incentives. (2024, April 26). Navigating mandatory Scope 3 emissions reporting in the EU, US, and beyond. https://alignedincentives.com/mandatory-scope-3-emissions-reporting-eu-us-uk-international/ ↵
- Yale Sustainability. (2023, November 14). Yale experts explain Scope 3 emissions. https://sustainability.yale.edu/explainers/yale-experts-explain-scope-3-emissions ↵
- For more on Scope 3 emissions, see EPA Centre for Corporate Climate Leadership. (2025). Scopes 1, 2 & 2 emissions inventorying and guidance. United States Environmental Protection Agency. https://www.epa.gov/climateleadership/scope-3-inventory-guidance# ↵
- EPA Centre for Corporate Climate Leadership (2025). ↵
- Vogl, A. J. (2004). The anti-CEO. Across the Board, May/June: 30–36. ↵
- Lloyd, B. (1994). Maverick! An alternative approach to leadership, company organization and management. Leadership & Organization Development Journal, 15(2): 8–12. https://doi.org/10.1108/01437739410055308. Semler describes the practice of Jack Welch, former CEO of General Electric, of firing the lowest-performing 10 percent of the workforce as “microterrorism.” See Vogel (2004: 35). ↵
- Page 98 in Semler, R. (2004). The seven-day weekend. Portfolio/Penguin Group. ↵
- Semler (2004: 98, 234). ↵
- Greenwald, C. (2004). WITSA study: World IT spending rebounds thanks largely to developing world. World Information Technology and Services Alliance. ↵
- Big data has been defined in the Oxford Dictionary as “extremely large data sets that may be analyzed computationally to reveal patterns, trends, and associations, especially relating to human behaviour and interactions.” (cited in Akoth, S. (2023, March 13). Bid data trends in the financial services for 2023 and beyond. Strathmore University Business School. https://sbs.strathmore.edu/big-data-trends-in-the-financial-services-for-2023-and-beyond/ ↵
- The following are two interesting book-length treatments examining the science of quantity versus quality, with much relevance to management decision making: Schwartz, B. (2004). The paradox of choice: Why more is less. ECCO; Klotz, L. (2022). Subtract. Flatiron Books. ↵
- Page 594 in Jones, G. R., & George, J. M. (2003). Contemporary management. (3rd ed.). McGraw-Hill Irwin. ↵
- Liedtke, M. (2025, January 2). Apple to pay USM to settle lawsuit accusing Siri of snoop eavesdropping. Winnipeg Free Press, B6. ↵
- Rachnya-Kyselova, H. (2024, February 23). Top 17 employee monitoring software industry trends 2024. WorkTime. https://www.worktime.com/employee-monitoring-software-industry-trends ↵
- Mettler, T. (2024). The connected workplace: Characteristics and social consequences of work surveillance in the age of datification, sensorization, and artificial intelligence. Journal of Information Technology, 39(3): 547–567. http://doi.org/10.1177/02683962231202535 ↵
- Even weak monitoring systems undermine interpersonal respect. Note also that introducing sanctions tends to make members see decisions more in terms of business rather than ethical terms. Tenbrunsel, A. E. & Messick, D. M. (1999). Sanctioning systems, decision frames, and cooperation. Administrative Science Quarterly, 44(4): 684–707. https://doi.org/10.2307/2667052 ↵
- Other numerical measures are also available. For example, observations that only three of its 3,000 members left Semco on their own over a two-year period, and that 1,400 engineers responded to a job advertisement suggest that Semco is seen as a good place to work. ↵
- Makower, J., et al. (2020). 2020 state of green business. GreenBiz Group. ↵
- For more on Tall Grass and the externalities baked into a loaf of bread, see Ridley, N. (Producer). (2024, June 12). Beyond Profit: Seeking Sustainability [Video]. https://www.youtube.com/watch?v=xzkn9Mm1X84 ↵
- Note the emphasis is on systems, not on motivating individuals per se. ↵
- Gartner, W. B., & Naughton, M. J. (2000). Out of crisis. In J. L. Pierce & J. W. Newstrom (Eds.), The manager’s bookshelf (pp. 53–58). Prentice Hall. ↵
- Deming originally had greater influence in Japan than in Western countries, perhaps because Western countries place a higher emphasis on individualism (the Japanese initially thought Deming was showing them how it was already being done in America). Many organizations have enjoyed improved performance when implementing the sorts of control systems consistent with Deming’s principles. For example, Ford Motor Company found that transmissions manufactured according to these principles resulted in warranty repairs decreasing tenfold, and that “things gone wrong” customer reports dropped by 50 percent over a period of five years. Other research claimed a fourfold increase in productivity when systems like TQM are introduced. For other examples, see Bhasin & Burcher (2006). ↵
- Kathan, M. C., Utz, S., Dorfleitner, G., Eckberg, J., & Chmel, L. (2025). What you see is not what you get: ESG scores and greenwashing risk. Finance Research Letters, 74(2): 106710. http://doi.org/10.1016/j.frl.2024.106710; Todaro, D. L., & Torelli, R. (2024). From greenwashing to ESG‐washing: A focus on the circular economy field. Corporate Social Responsibility & Environmental Management,13. http://doi.org/10.1002/csr.2786; Serafeim, G. (2020). Social-impact efforts that create real value. Harvard Business Review, 98(5): 38–48. https://hbr.org/2020/09/social-impact-efforts-that-create-real-value; Chopra et al. (2024). ↵
- Pettigrew, A. M. (1985). The awakening giant: Continuity and change in ICI. Basil Blackwell. ↵
- Bhasin & Burcher (2006). Deming has suggested that the process of transforming an entire organization to his approach can take a minimum of ten years (Gartner & Naughton, 2000). ↵
- O’Boyle, T. F. (1998). At any cost: Jack Welch, General Electric, and the pursuit of profit. Alfred A. Knopf. ↵
- Nielsen, R. P. (1998). Quaker foundations for Greenleaf’s servant-leadership and “friendly disentangling” method. In L. C. Spears (Ed.), Insights on leadership (pp. 126–144). John Wiley & Sons. ↵
- For example, the suppliers and key customers of Malden Mills were very gracious in allowing delays and extending credit when the firm burned down, thanks in large part to SET management at Malden Mills, where employees received pay even though they could not work during the time when the factory was being rebuilt. Batstone, D. (2003). Saving the corporate soul and (who knows?) maybe your own. Jossey-Bass; Leung, R. (2003, July 3). The mensch of Malden Mills. 60 Minutes. CBSNews.com. https://www.cbsnews.com/news/the-mensch-of-malden-mills/ ↵
- Of course, there are times when SET managers must make decisions and take action without having time to consult widely. However, this is not the default mode—the default in the SET approach is the much more challenging and rewarding mode of trusting the instincts of others. From an FBL perspective this may seem like managers are shirking their responsibility, while from a SET perspective it is part of treating others with dignity and respect. This respect is evident and built into each one of the four parts of the SET approach to the control process. ↵
- Semler (2004: 122). ↵
- For examples, see Lu, J. W. (2002). Intra-and inter-organizational imitative behavior: Institutional influences on Japanese firms’ entry mode choice. Journal of International Business Studies, 33(1): 19–37. http://doi.org/10.1057/palgrave.jibs.8491003; see also Nelson, T. (2003). The persistence of founder influence: Management, ownership, and performance effects at initial public offering. Strategic Management Journal, 24(8): 707–724. http://doi.org/10.1002/smj.328 ↵
- Sydow, J., Schreyögg, G., & Koch, J. (2009). Organizational path dependence: Opening the black box. Academy of Management Review, 34(4): 689–709. https://www.researchgate.net/publication/228807334_Organizational_Path_Dependence_Opening_the_Black_Box ↵
- Marquis, C., & Tilcsik, A. (2013). Imprinting: Toward a multilevel theory. Academy of Management Annals, 7(1): 195–245. https://doi.org/10.5465/19416520.2013.766076. Imprinting effects can also influence subsequent intrapreneurial behavior in organizations: Dyck, B. (1997). Exploring organizational family trees: A multi-generational approach for studying organizational births. Journal of Management Inquiry, 6(3): 223–233. https://doi.org/10.1177/105649269763007 ↵
- Boeker, W. (1989). Strategic change: The effects of founding and history. Academy of Management Journal, 32(3): 489–515. https://doi.org/10.2307/256432 ↵
- Nelson, T. (2003). The persistence of founder influence: Management, ownership, and performance effects at initial public offering. Strategic Management Journal, 24(8): 707–724. https://doi.org/10.1002/smj.328 ↵
- Shourkaei, M. M., & Dyck., B. (2023). Scaling sustainability in businesses with a post-growth orientation: An exploratory empirical study [Working paper under third review]. ↵
- Kim, S., & Kim, A. (2022). Going viral or growing like an oak tree? Towards sustainable local development through entrepreneurship. Academy of Management Journal, 65(5): 1709–1746. https://doi.org/10.5465/amj.2018.0041 ↵
- See the Eadha Bakery Co-op company website at https://eadhacoop.com. See also Dyck, B., Manchanda, R. V., Vagianos, S., & Bernardin, M. (2023). Sustainable marketing: An exploratory study of a sustain-centric, versus profit-centric, approach. Business & Society Review, 128(2): 195–216. https://doi.org/10.1111/basr.12314 ↵
- McCormick, E. (2022, September 15). Patagonia’s billionaire owner gives away company to fight climate crisis. The Guardian. https://www.theguardian.com/us-news/2022/sep/14/patagonias-billionaire-owner-gives-away-company-to-fight-climate-crisis-yvon-chouinard ↵
- Since the time of the Roman empire, management theory has looked at these three basic domains or relationships that need to be managed. For more on the three main domains of management through history, see oikonomia, chrematistics and patron-client relations in Dyck, B. (2013a). Management and the Gospel: Luke’s radical message for the first and twenty-first centuries. Palgrave-Macmillan. ↵
- For example, at Reell Precision Manufacturing, executive pay is limited to roughly seven to ten times that of the lowest-paid employee; see page 21 in Benefiel, M. (2005). Soul at work. Seabury Books. ↵
- Anon. (2006). Training best practices. Training, 43(3): 60–63. Previously found at http://www.astd.org/. Supporting a person who is completing a general education degree may or may not have instrumental value in the workplace, but it enhances the dignity of the person who earns it. ↵
- “These axioms are as much statements of common sense as they are theoretical statements.” Taken from pages 11–23 in Keown, A., Petty, W., Scott, D., Martin, J. (1998). Foundations of finance: The logic and practice of financial management (2nd ed.). Prentice Hall. Parts of this Table 18.4 also appear on page 158 in Dyck, B. (2013b). A proven way to incorporate Catholic Social Thought in business school curriculae: Teaching two approaches to management in the classroom. Journal of Catholic Higher Education, 32(1): 145–163; and in Dyck (2013a). ↵
- Antagonism and dysfunctional status differentials would be created if one neighbor were to start to make exceptional profits due to having a virtual “monopoly” (which is what having a unique product or service that others couldn’t imitate was called long before it was dubbed “competitive advantage”). ↵
- Table 18.5 and the discussion of the four assumptions of accounting draws heavily from Dyck (2013a: 175; 2013b: 157), which in turn draws from and builds on Christie, N., Dyck, B., Morrill, J. & Stewart, R. (2013). CSR and accounting: Drawing on Weber and Aristotle to rethink generally accepted accounting principles. Business & Society Review, 118(3): 383–411. https://doi.org/10.1111/basr.12015 ↵
- Larson, P. D., & Halldorsson, A. (2004). Logistics versus Supply chain management: An international survey. International Journal of Logistics: Research & Applications, 7(1): 17–31. http://dx.doi.org/10.1080/13675560310001619240 ↵
- Table 18.6 adapted from Dyck (2013a). ↵
- Operations management includes methods of (a) break-even analysis (determine the sales volume and prices required to earn a profit, decide which product lines to keep and which to drop, set prices for products and services); (b) forecasting (projections that help plan for production targets, whether and when to expand production facilities); (c) inventory modeling (help managers decide on timing and quantity for ordering supplies to maintain an optimal inventory, how much end-product inventory to keep on hand); (d) linear programming (how to allocate scarce resources among competing uses); and (e) simulations (mathematical models that permit testing the outcomes associated with making different decisions). ↵
- American Marketing Association. (n.d.). Definitions of Marketing. Retrieved May 2016, from https://www.ama.org/AboutAMA/Pages/Definition-of-Marketing.aspx ↵
- The four P’s were developed by McCarthy, E. J. (1964). Basic marketing: A managerial approach. R. D. Irwin; Kotler and Keller add that the “right” four P’s create a fifth P, profits, and that “one of the shortest good definitions of marketing is meeting needs profitably.” Page 25 in Kotler, P. T., & Keller, K. L. (2012). Marketing management (14th ed.). Pearson. ↵
- This table draws heavily from Dyck, B., & Manchanda, R. (2021). Sustainable marketing based on virtue ethics: Addressing socio-ecological challenges facing humankind. Academy of Marketing Science Review, 11(1): 115–132. http://doi.org/10.1007/s13162-020-00184-7. See also Dyck et al. (2023); Dyck (2103a, 2013b); and Kotler, P., Kartajaya, H., & Setiawan, I. (2010). Marketing 3.0: From products to customers to the human spirit. John Wiley & Sons. ↵
- Mohammed, R. (2012). How to find out what customers will pay. Harvard Business Review. Retrieved December 30, 2024, from https://hbr.org/2012/09/how-to-find-out-what-customers-will-pay ↵
Seeks to ensure that an organization’s activities serve to accomplish its goals. (See section 18.1)
The sequence of activities needed to convert an organization’s inputs into outputs. (See section 18.2.1)
Determines whether an organization’s inputs meet its performance standards. (See section 18.2.1)
Determines whether an organization’s conversion processes meet its performance standards. (See section 18.2.1)
Determines whether an organization’s outputs meet its performance standards. (See section 18.2.1)
Mechanisms that identify, collect, organize, and disseminate information. (See section 18.2.2)
Facts and figures, some of which managers deem useful but the majority are not. (See section 18.2.2)
Data that have been given meaning and value. (See section 18.2.2)
Systems used to record customer orders, track purchases from suppliers, and so on. (See section 18.2.2)
Used to monitor and coordinate the flow of work between various organizational subunits and their suppliers. (See section 18.2.2)
Used to gather and manipulate data from a variety of sources to help evaluate performance. (See section 18.2.2)
How managers can continuously improve organizational work systems so that products and services better meet the quality desired by customers. (See section 18.2.3)
The tendency for organizations to take on qualities that reflect conditions when they were founded and to continue displaying those qualities after the founding stage. (See section 18.3)
Withdrawing one’s financial investment (i.e., ownership) in an organization with the intent of achieving financial gain by doing so. (See section 18.3)
Transferring one’s ownership to new owners with the intent of facilitating further socio-ecological well-being. (See section 18.3)

Feedback/Errata