Part 1: Background and Basics
4. Management and Ecological Well-Being: Energy, Food Systems, and Health
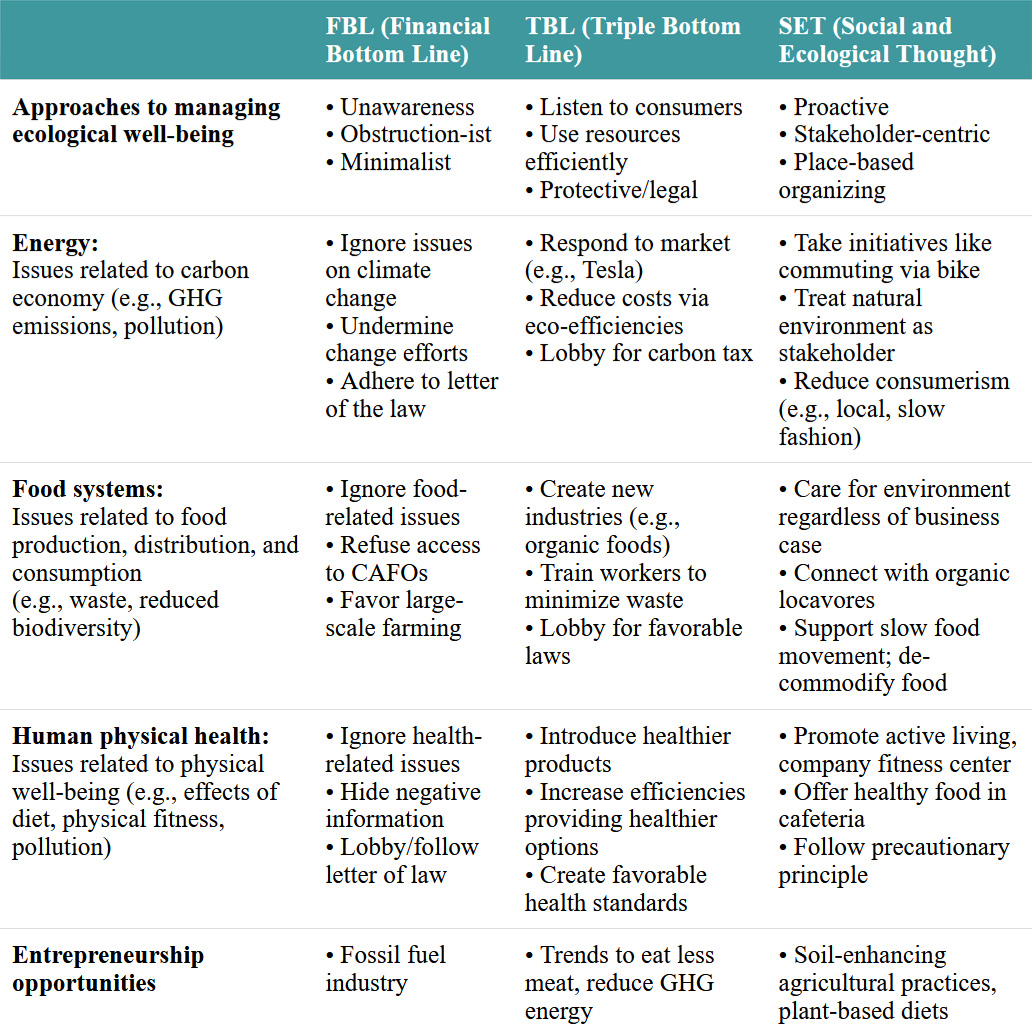
Chapter 4 provides an overview of the relationship between management and ecological well-being, with a focus on energy, food systems, and health, as summarized in the following table and in the whiteboard animation video.
Learning Goals
After reading this chapter, you should be able to:
- Explain differences in the FBL, TBL, and SET approaches to ecological well-being.
- Describe the carbon cycle and identify positive contributions and negative externalities associated with carbon-based energy.
- Identify problems and opportunities that exist in the global food system.
- Explain the linkages between ecological well-being and human health.
- Identify entrepreneurial opportunities related to ecological well-being.
4.0. Opening Case – Coffee: A Dark Roast
Gabriel Calderon is a fourth-generation coffee farmer in the Central Valley of Costa Rica. When Gabriel was a young adult his father became very ill, and extensive testing revealed that the chemicals deployed to make their coffee commercially viable were causing sickness and threatening their lives. His father’s near-death experience prompted Gabriel to research everything about coffee and coffee production, and what he learned was unsettling.
Coffee is a juggernaut in the global economy. It’s a $200 billion industry and the world’s third-largest traded commodity.[1] Starbucks alone has annual revenue of $36 billion.[2] The 3 billion coffee cups that are consumed each day support the livelihoods of some 125 million people.[3] While concerns of fair and just treatment of farmers in the supply chain persist, it is clear that coffee provides livelihoods and financial benefits to many global citizens, and a pleasing beverage to more than a billion.[4]
But what about the social and environmental impacts of coffee production? Coffee is harvested only once a year, requiring a large assembly of labor for just one month. Because of both the intermittent work and the toil of the task, coffee harvesting tends to utilize migrant labor for all but very small farms. Migrant and transient work has negative social implications, often dislocating and separating families, and disrupting the education and health workers’ children. Another social concern is the relatively low wages paid to coffee pickers, and while there are frequent fair trade appeals to more justly reward all stakeholders, gross inequity of wages and returns persist throughout the coffee industry.
Environmental impacts are numerous. The coffee fruit is harvested as a cherry, and while the peel and pulp contain good nutritional value for humans,[5] these are stripped away in the process of obtaining the bean (seed), which is then dried, roasted, ground, and filtered. Only 0.001 percent of the nutrient value of the cherry is consumed in a typical coffee drink. Processing coffee from cherry to consumable drink requires significant water and energy. The typical commercial process requires 100 liters of water to process one cup of coffee. If we add the water needed to grow the cherries, it takes an estimated 3 cubic meters of water per cup of consumed coffee. Vast amounts of heat are required to dry the bean for storage and shipping, and then additional heat is used in the roasting process. The (green) unroasted bean is quite heavy and dense, leading to significant transportation costs, both financially and ecologically. Other than in Ethiopia, which is the only place on Earth where the plant is indigenous, coffee requires regular chemical inputs to support financially viable commercial scale farming. Fertilizers such as nitrates are needed to restore depleted soils, and pesticides and herbicides are required to maximize yields. In addition to leaching into the ground, these chemicals are often carried with erosion into streams that contaminate groundwater and threaten human health and wider natural ecosystems.
Climate change is also driving feedback loops with coffee production. The optimal conditions for growing coffee typically occur within a narrow altitude band, but changes in temperature and rainfall are pushing coffee cultivation into higher elevations and more fragile ecosystems. This push is often onto steeper grades, resulting in higher levels of erosion and runoff of synthetic chemicals. A warming planet also threatens coffee trees at lower elevations, leading farmers to respond with still greater levels of chemical inputs like those that nearly took the life of Gabriel’s father.
Confronting these negative impacts was unsettling for a fourth-generation coffee farmer like Gabriel Calderon. He knew that he could not subject his family to the risks of chemical exposure, so he set out to explore alternatives. He implemented organic farming techniques, replacing synthetic chemicals with a combination of integrated pest management, intercropping, and physical/labor defenses. To manage insects that threaten to devour the leaves or fruit of his coffee, Gabriel added other plants that the bugs prefer; this form of natural pesticide is rarely as effective as chemicals, but chemicals also disrupt the natural ecosystem, often leading to unintended consequences. Rather than adding chemical fertilizers, Gabriel grew other plants alongside the coffee that fix nitrates to the soil and other nutrients that coffee trees deplete. Visitors to his farm, El Toledo, can witness in action these intercropping and integrated pest management approaches, which aspire to work with nature rather than against it. Adapting to the rising temperatures and uneven rainfall of climate change, Gabriel added trees for a canopy to strategically shade his coffee plants. He hired permanent local workers to replace what chemicals might have otherwise performed, and this built demand for year-round labor and cut demand for transient workers.
Initially the transition to organic farming reduced El Toledo’s coffee yield by 50 percent, placing the farm on the edge of survival. Only 3 percent of the world’s coffee is organically grown,[6] which illustrates the financial challenge of making changes for non-financial reasons, in this case to reduce social and environmental harms. For the coffee farm to thrive, Gabriel needed to find other sources of revenue. He began experimenting with different fruit trees that could also serve the goals of shade, intercropping, and integrated pest management; now he has cacao, banana, mango, papaya, and other fruits as a revenue stream to augment that from coffee. Gabriel learned how to make wine and “coffee tea” from the skin of the cherry, which is considered a nuisance in commercial processing. He also makes flour and jams from the pulp of the cherry, another waste product of commercial coffee. He invested in equipment that processes the coffee without water, and he uses sunshine rather than fuel to dry the beans. Gabriel opened El Toledo for others to visit and learn about coffee and his unique story and approach, and all these initiatives have widened and diversified the revenue base for the farm.
Gabriel shares this story and further insights in a coffee tour, where his first order of business is to encourage his guests to stop drinking coffee, or at least to reduce their consumption. More than 11 million hectares (27 million acres) are under coffee cultivation in over fifty countries,[7] and Gabriel transparently expresses his conflict over being a coffee farmer in a world where too many people struggle to meet their basic food needs. He exposes coffee for what it is: a luxury good for the global elite, and a product and process that has many unfortunate social and ecological impacts. Gabriel reminds visitors that what looks or seems normal and right is simply passed along to us by our family and the culture in which we live, yet we know that “business as usual” is not working well for all creatures today and especially into the future. Does Gabriel’s story prompt a reconsideration of any of your lifestyle decisions?[8]
4.1. Introduction
There is a growing consensus that managers in all kinds of organizations must increase their awareness and knowledge of fundamental ecological issues and systems. Organizations have a significant impact on the natural environment, but they also have great opportunities to reduce negative externalities and enhance positive externalities. In this chapter, we describe the differing assumptions about the natural environment that characterize Financial Bottom Line (FBL), Triple Bottom Line (TBL), and Social and Ecological Thought (SET) management and consider their differing approaches to managing ecological well-being. In doing so, we describe the carbon economy and then examine management issues regarding energy, food systems, and human health. As you read through the chapter, think not only about the changes that business needs to make in how it relates to the natural environment but also about how these imperatives can serve as opportunities during your career.
4.2. Keys to Managing Ecological Well-Being: Approaches to Energy, Food Systems, and Human Health
Ecological well-being is evident when the Earth’s natural systems are functioning in a way that sustains and enhances the flourishing of life.[9] Just as the health of human beings depends on the proper functioning of various systems (the cardiovascular system, the respiratory system, the gastrointestinal system, and so on), so also the Earth has many systems that need to function well in order for the planet to sustain life as we know it (for most of its billions of years of history, the conditions on planet Earth would not have sustained humankind).[10] And just as unhealthy behavior can create problems for our bodily systems (e.g., smoking cigarettes affects our respiratory system and can cause cancer), so also human activities can create problems for the Earth’s natural systems. The limits of six of nine key systems necessary to sustain ecological well-being have already been exceeded, in large part due to the behavior of humankind.[11] Indeed, scientists are suggesting that the planet is entering a new geological epoch, called the Anthropocene, triggered by human activity particularly since 1950.[12]
Today, ecological well-being has become a prominent concern, and it is one of the primary goals in both TBL and SET organizations. As recently as a decade ago, the natural environment was rarely mentioned in management textbooks. The natural environment is composed of all living and non-living things that have not been created by human technology or human activity.[13] The natural environment provides important organizational inputs (e.g., raw materials, natural resources, minerals, water, air), but it is also used as a place to dispose of organizational waste (pollution, greenhouse gas emissions, etc.).
Humankind has been using an increasing amount of the Earth’s resources over time. This is due not only to a growing global population—from 350 million people in 1350, to 1 billion in 1804, to over 8.1 billion today—but also because we have been taking greater portions of resources to serve our needs and wants. The idea of an ecological footprint—which refers to the amount of the Earth’s natural resources that are required to sustain a particular lifestyle or activity—is becoming a popular way for managers to think about how many natural resources their organizations use.[14] Researchers have divided the total biocapacity of the planet’s productive land and marine areas into units called global hectares, and they estimate that the planet has about 12 billion global hectares of biocapacity available, which is about 1.6 global hectares per person.[15]
For about 14,000 years, until 1820, our average ecological footprint was between 1.2 to 1.3 global hectares per person. This increased to 1.86 hectares per person by 1950 and has stabilized around 2.70 hectares per person since 1970. In other words, humankind is today consuming over 150 percent of the Earth’s sustainable biocapacity.[16] Put more simply, we are living beyond the carrying capacity of the planet. For example, we are using up nutrients in the croplands and fish in the oceans at a greater rate than they are being replenished, and we are putting CO2 into the atmosphere at a greater rate than it can be taken out. Between 1965 and 2005, the ecological footprint in high-income countries increased from about 4.3 to 7.8 global hectares per person. There was a smaller increase in middle-income countries, from 2.0 to 2.2, and in low-income countries it decreased from about 1.2 to 1.0.[17]
While efforts to become more sustainable can start at the household level, it is even more critical that the world’s business organizations become more sustainable. Recall that the world’s largest 1,200 corporations created $5 trillion in negative ecological externalities in 2018, an increase of 50 percent from five years earlier,[18] and greater than their total profit. Consider also that even if every household were to recycle 100 percent of the goods it consumes, this would still solve only 5 percent of the pollution problem, because more than 75 percent of waste in countries like the United States is industrial waste.[19] As such, ecological well-being demands close consideration of the organizations that produce the goods we consume; these organizations mine, transport, and transform the raw materials that become our smartphones, cars, and soda cans.
4.2.1. Ecological Well-Being
As we described in the first chapter, the three approaches to management conceive of the relationship between ecological, social, and financial well-being differently. FBL management considers economic activity to be separate and independent from the larger natural and social environments. TBL management suggests that economic activity is interdependent with the natural and social environments. And the SET approach suggests that economic activity is dependent on social and ecological well-being.
FBL Approaches to Ecological Well-Being
FBL organizations tend to use one or more of three approaches or methods to manage ecological well-being: unawareness, obstruction, or legal conformity.
Unawareness: FBL management focuses on information from the financial markets to make decisions vis-à-vis the natural environment. Thus FBL managers seek to source natural resources from regions that offer the lowest financial prices and build factories in countries that have the least expensive financial costs associated with pollution. In short, FBL management is unaware of, or perhaps purposely ignores, issues related to ecological well-being and the carrying capacity of the planet, except insofar as these are reflected in financial transactions. From an FBL management perspective, it is the role of government to safeguard ecological well-being. Indeed, even FBL exemplar Milton Friedman favored environmental taxes.[20]
There are two good reasons why FBL management has historically not paid much attention to the ecological environment, and specifically to the negative ecological externalities associated with the production of goods and services. First, over the course of most of our history, humankind has had a minuscule effect on the planet’s natural environment. Second, until recently managers have not been educated to take into account the idea of ecological well-being (e.g., many managers are unfamiliar with the carbon cycle or land-use issues). This is changing with a younger generation of managers, but senior leadership is still lagging. In one international study, 67 percent of managers “strongly agreed” that climate change is real, but only 36 percent “strongly agreed” that the leadership of their firm believed climate change is real.[21]
Obstruction: Obstruction is evident when managers are aware of the negative ecological externalities created by their organizations but work against any efforts to address them because they fear it will decrease their own financial well-being or that of their organization (e.g., when oil companies use social media to deny or downplay the dangers of fossil fuels and climate change[22]). This may sometimes lead to illegal activity and doing whatever it takes to prevent knowledge of such behavior from reaching other organizational stakeholders and society at large. For example, tobacco companies have withheld data that point to the cancer-causing effects of cigarettes,[23] and Volkswagen (VW) was caught using technology to cheat emissions tests to make its vehicles more attractive to consumers. The “Dieselgate” scandal cost VW more than $38 billion in direct expenses, reduced stakeholder goodwill, tarnished its brand reputation, and diminished customer loyalty.[24]
Legal conformity: Legal conformity is a defensive stance taken by managers who are aware of the negative ecological externalities created by their organizations but do only what is minimally and legally required to address them (which includes paying penalties if that is less expensive than compliance). Managers adopting this approach exhibit little environmental sensitivity. They will insist that their employees behave legally, but then put the financial interests of shareholders first, at the expense of other stakeholders and the environment. For example, Willamette Industries of Portland, Oregon, agreed to install $7.4 million worth of pollution control equipment in its thirteen factories to comply with Environmental Protection Agency requirements. But the move came only after Willamette had been fined $11.2 million for violating emissions standards.[25]
TBL Approaches to Ecological Well-Being
TBL management tends to follow one or more of the following three approaches to ecological well-being: respond to customer demand, implement financial cost efficiencies, and support self-serving legislation.
Customer demand: TBL management seeks to respond to the growing demand for ecologically friendly products and services, recognizing that this will enhance the firm’s financial performance. For example, the 2023 Business of Sustainability Index (BOSI) shows that 72 percent of millennials and 77 percent of Gen Zers are willing to pay extra for goods and services from firms committed to positive ecological and social practices (up from 55 percent in 2014).[26] Entire industries have been created by the desire to be green, from windfarms that generate renewable energy, to community-supported agriculture (CSA), to consultancies related to the Global Reporting Initiative (which works in cooperation with the United Nations Global Compact and helps organizations monitor and report their environmental performance).
Unfortunately, sometimes businesses are tempted to participate in greenwashing, which refers to deliberately using misleading information in order to present a false image of ecological responsibility. This practice is widespread enough that it has made consumers skeptical and has undermined the green movement. People seek to minimize greenwashing via websites like that of the Greenwashing Index to rate different products and by establishing industry-specific third-party organizations to accredit whether a product is ecologically friendly (e.g., the Marine Stewardship Council).[27]
Relying on customer demand to drive ecological sustainability can be troublesome because customer demand is sometimes fickle. For example, whenever gasoline prices go up due to an oil crisis, automobile manufacturers increase their emphasis on fuel-efficient cars. However, when the prices decline and the market appears ready for bigger and less fuel-efficient cars, the auto industry is quick to invest marketing and production dollars in often more profitable but less environmentally friendly cars and SUVs. Under TBL management, the market drives production decisions, even when this does not promote ecological well-being.
Efficiency: TBL management supports business cases that show how reducing negative ecological externalities can lower an organization’s financial costs for example, via reducing packaging for goods, using LED lighting, and choosing more energy-efficient transportation options for the flow of goods. Advanced tools have been developed, such as life-cycle assessment (LCA). Life-cycle assessment identifies areas where there could be ecological benefits and financial savings in the overall process of how an organization sources raw materials, transforms them into new products, and sells them to customers, and how they are used, maintained, and disposed of by consumers. LCA often embraces cradle-to-cradle design, which seeks to ensure that the material content of products at the end of their useful life can be reused to make new products and that new products are made from expired products (thereby reducing the use of new raw materials). For example, Interface Incorporated uses tools like LCA to reduce its net ecological footprint to zero (see opening case, Chapter 13; see also Chapter 18).
Stricter legislation: Sometimes it is in the interests of TBL managers to support stricter government legislation and increased taxes related to green practices, such as when their firm has developed patented green technologies that are better than its competitors’, or when their firm is in danger of losing its reputation internationally because of environmentally unfriendly practices in its domestic market. Although corporations’ public statement about climate-related policies sometimes change over time, many Fortune 100 companies took out advertisements in 2017 to encourage the US government to remain committed to the Paris Climate Accord, even promoting carbon taxes.[28] Carbon taxes are a type of green tax designed to reduce use of CO2-emitting technologies that degrade the environment.[29] As implemented in a growing number of countries, such taxes are often phased in over a period of years to allow for a smooth transition, with money raised directed toward health-related and clean-up costs associated with pollution, thereby ensuring that people pay for the negative externalities they create.[30] Some critics argue that governments that promote carbon taxes undermine the international competitiveness of their businesses, but proponents respond by noting that green taxes can stimulate the development of environmentally friendly technologies that will be increasingly in demand going forward. Countries like Denmark, Sweden, the Netherlands, Britain, Germany, and Canada have been leaders in implementing green taxes.
SET Approaches to Ecological Well-Being
SET management promotes more proactive, stakeholder-centric, and/or place-based approaches to enhancing ecological well-being.
Proaction: A proactive approach is evident when without being prompted by a stakeholder or a business case to do so, managers take the initiative to seek opportunities to enhance the natural environment. These managers go out of their way to initiate contact with and learn about the needs of different stakeholder groups, and are willing to use organizational resources to promote the interests of the community and the environment. For example, in 2007, the presidents of some of the most prestigious American universities pledged to make their campuses carbon neutral: “We’re saying that sustainability is no longer an elective.”[31] Taylor Guitars (Chapter 1) was being proactive when it began to increase sustainability practices related to the ebony wood in its products.
Stakeholder centrism: A stakeholder-centric approach takes into account customer demand but also listens to other stakeholders such as neighbors, business partners, and special interest groups, even if doing so does not maximize an organization’s financial well-being (note that FBL and TBL approaches also attend to stakeholders, but only when it serves a firm’s financial interest). The SET approach acknowledges the need to make ecological choices that are reasonable in the eyes of the larger society, even if there is no business case to do so. This is evident when businesses install extra equipment to minimize noise or chemical pollution, not because it is profitable or legally required but simply because it is respectful of their community (see this chapter’s opening case of El Toledo using equipment to process coffee without water even though that is more costly).
Place-based organizing: For most of its history, humankind has lived in agrarian or hunter-gatherer societies. Today many of us live in concrete jungles and have few reminders of the beauty and harshness of the natural environment. This disconnectedness from place is celebrated and captured in the FBL idea of a “flat world,” where technological advances are said to make geographical and regional differences irrelevant.[32] Unfortunately, our disregard for place has coincided with a rise in negative ecological externalities. To counteract this, SET management promotes place-based organizing (PBO), which is evident when an organization’s ownership, productive activities, and resources are located in a specific geographic place.[33] PBO not only enhances ecological well-being, it also has locally beneficial social and economic outcomes (see Chapter 3), and is consistent with the “buy local” movement and related ideas like “slow fashion.”
In terms of enhancing positive ecological externalities, PBO increases the likelihood that an organization’s members will care about and care for ecological well-being (rather than merely exploiting natural resources), become mindful of the integral connections between ecological well-being and the organization’s socio-economic well-being, and put relatively more emphasis on socio-ecological value creation than on maximizing financial well-being.[34] For example, organic agricultural practices such as those evident in place-based organizations like El Toledo Farm (see opening case) provide ten to fifty times more benefits to ecological well-being (e.g., improved soil health, removal of carbon from the atmosphere) to their local community than industrial agriculture does.[35] PBO also creates positive social externalities by enhancing community, social capital, philanthropy, and participation in local politics.[36] Mental health and creativity are higher in firms that offer nature-based interventions such as outdoor exercise, nature-centered activities, and opportunities to engage with green spaces.[37] Finally, people who feel connected to their natural surroundings are kinder, less stressed, and enjoy greater overall well-being.[38]
In terms of negative ecological externalities, PBO reduces the outsourcing of pollution from rich to poor countries, where environmental standards are lower and/or are not enforced.[39] PBO can also reduce negative externalities associated with long-distance transportation of goods.[40] Furthermore, evidence shows that closer social connections lead to reduced negative social externalities. When consumers purchase goods from local factories where they can watch what is happening and have face-to-face relationships with some of the workers, those factories are less likely to have exploitive working conditions.[41] Examples of PBO include CSAs, farmers’ markets that sell local produce and handcrafts, and businesses like the Tall Grass Prairie Bread Company in Winnipeg, Manitoba, which offers organic breads made from locally grown and milled grains.
Test Your Knowledge
4.2.2. Energy and the Carbon Economy
In order to think effectively about ecological well-being, managers must have an understanding of the carbon economy.[42] Carbon has been called “the currency of life” because of its role in providing energy to plants and animals in the food web.[43] This is part of the carbon cycle, which in simple terms describes how carbon moves back and forth between humans and other animals, the atmosphere, plants, and other parts of the environment.
To understand the carbon cycle at a very basic level, it can be helpful to think about carbon-containing molecules as storing different amounts of energy, depending on how carbon combines with other elements.[44] An example of a high-energy carbon molecule is sugar (C6H12O6). When we eat sugar, it provides energy for our bodies. After releasing its energy, the carbon is ultimately expelled in the form of a low-energy carbon molecule, such as carbon dioxide (CO2). Then, through the process of photosynthesis, plants take CO2 as an input (along with other inputs like water and energy from the sun) and transform it back into a high-energy form (e.g., sugar). The carbon cycle has been sustaining life on Earth this way for billions of years.
Moreover, other sources of high-energy carbon molecules have also played a central role in providing energy that has enabled the development of civilization as we know it. This started with the human discovery of how to use fire—that is, releasing the energy from high-energy carbon molecules stored in wood in the form of heat—which improved the efficiency of how we prepared food.
Carbon also played a role in another major shift that started about 12,000 years ago, with the transition from hunting and gathering to agriculture. Crops need carbon and other resources from the soil, yet it is estimated that as much as 50 to 70 percent of the carbon in cultivated soils has been lost over time,[45] thanks to practices like repeatedly plowing the soil, which releases carbon into the atmosphere at the rate of about 1 tonne per hectare plowed.[46] Over the past 10,000 years the Earth has lost about 16 percent of the total amount of carbon in its soil. Until about 1950, more carbon was entering the atmosphere from changes in land use (e.g., soil degradation, deforestation) than from burning fossil fuels.[47] However, since 1950 emissions from burning fossil fuels have doubled, while emissions because of changes in land use have stabilized.[48]
The exploitation of high-energy carbon molecules in fossil fuels played a major role in ushering in the Industrial Revolution, when humankind began to master the ability to use hydrocarbons to power machinery. High-energy carbon molecules are the main ingredient in the coal, oil, and natural gas that—when combined with oxygen and a spark—produces the energy we use to power our vehicles, heat and cool our homes, and run our electronic gadgets and machinery. Fossil fuels are made up of high-energy carbon molecules that were deposited into the ground during millions of years of pre-human history. Crude oil is about 85 percent carbon by weight. One barrel of oil (about 159 liters and 135 kilograms) has about 6 billion joules of energy (about 1.43 billion calories), which is the equivalent energy of a human working twelve hours per day, 365 days per year, for 3.8 years (a healthy person on a treadmill or bike can put out enough energy to light a 100-watt bulb for an hour, which is about 360,000 joules per hour). The average North American uses about twenty-three barrels of oil per year, the equivalent of having eighty-nine laborers working under slave-like conditions for twelve hours per day, 365 days per year.[49] In the same way, one cup of gasoline has the equivalent energy of about fifty hours of heavy manual labor. It is little wonder that carbon-based energy has contributed so dramatically to the development of civilization as we know it.[50]
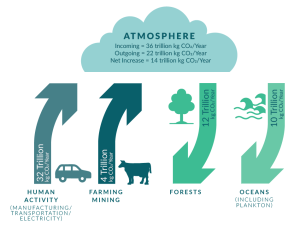
Unfortunately, our use of fossil fuels is adding more CO2 (low-energy carbon molecules) into the atmosphere than photosynthesis and other Earth systems can remove. Overall, each year there is a net gain of about 14 trillion kilograms of CO2 in the Earth’s atmosphere. As depicted in Figure 4.1, much of this is due to fossil fuels and industry, which adds 32 trillion kilograms of CO2 to the atmosphere each year.[51] Land-use changes like farming, mining, and deforestation are adding another 4 trillion kilograms of CO2 annually.[52] Of these annual emissions of 36 trillion kilograms of CO2, plants are able to remove about 12 trillion kilograms of CO2 (via photosynthesis) and oceans absorb another 10 trillion kilograms of CO2 (mostly thanks to plankton), resulting in the net addition of 14 trillion kilograms of CO2 per year.[53] As a result of the net increase, atmospheric CO2 levels have risen from 280 parts per million to 420 parts per million, whereas 350 parts per million is considered to be the upper boundary of sustainability (our planet’s atmospheric CO2 never exceeded 300 parts per million in the 650,000 years prior to 1950).[54] On an encouraging note, humankind’s energy-related CO2 emissions seem to have stabilized (at about 37 trillion kilograms per year) even as the global economy has continued to grow.[55]
Figure 4.1. Simple depiction of the carbon cycle
Most scientists believe that the increase in carbon in the atmosphere contributes to climate change via a process called the greenhouse effect. A greenhouse becomes warmer thanks to its roof and walls being made out of clear plastic or glass that allows the sun’s rays to enter, but that thin layer also makes it difficult for the heat inside the greenhouse to escape. In the same way, the additional CO2 in the atmosphere permits the sun’s rays to heat the Earth but makes it more difficult for that heat to escape.
Scientists generally agree that climate change is occurring (the ten warmest years since 1880 have occurred in the last decade, with 2024 being the first year that Earth has crossed the 1.5 degree Celsius threshold of global warming[56]) and that it is caused by higher amounts of greenhouse gases (GHGs) like CO2 in the atmosphere, added by the activities of humankind.[57] Climate change creates many problems, such as melting the polar ice caps (about 417 billion cubic meters of ice melted between 2002 and 2007; and between 1980 and 2017 the total size of the polar ice caps decreased by about 25 percent, going from an area of 21 million to 16 million square kilometers[58]), which in turn is increasing water levels (the sea level increased about 1.7 millimeters per year from 1870 to 1994, and has been increasing by about 3.4 millimeters per year since then[59]). Many of the world’s thirty-three megacities are vulnerable to rising sea levels, coastal storm surges, and extreme heat.[60]
Another negative externality associated with more CO2 in the atmosphere is that more of it is being absorbed into the oceans, which reduces the pH of the ocean and causes acidification.[61] The acidity of ocean surface water has increased about 30 percent since the Industrial Revolution. While the ocean’s absorption of CO2 may slow down climate change in the short term, unfortunately it may compromise the resilience of plankton and their ability to remove carbon in the long term. This may not seem like a big worry, but plankton provide half the food eaten by marine animals and remove a large percentage of the carbon from the atmosphere.[62]
The FBL Approach to Energy and the Carbon Economy
Some proponents of FBL management correctly note that although there is widespread agreement among scientists that the increasing level of CO2 in the atmosphere is causing climate change, which threatens the Earth’s systems that support life as we know it, this is difficult to prove unequivocally. They are also correct to point out that there have been similar fluctuations in temperature in the Earth’s distant past. The planet’s systems are very complex and seem to be very adaptable to change. For FBL managers who make these points, it makes sense to keep using fossil fuels as the source of energy that drives our economy because it is the least expensive way (in the short term) to generate high profits. Such an FBL approach involves little concern about climate change and may obstruct or minimize standards designed to curb the use of fossil fuels, as illustrated by fossil fuel companies that provide funding to think tanks and by political candidates who deny that climate change is real.[63] Of course, not all FBL managers deny climate change; but recall that the FBL approach is consistent in arguing that it is the responsibility of government, not business, to address ecological issues.
The TBL Approach to Energy and the Carbon Economy
TBL managers seek to develop new products and services that address consumer concerns about protecting the environment. For example, given that 28 percent of GHG emissions in the United States come from transportation,[64] TBL firms like Tesla have developed electric cars that produce zero CO2 emissions when they are driven. However, a portion of the electricity that powers electric cars is often created using fossil fuels, and the manufacture and recycling of batteries in electric cars creates other unique environmental harms. New industries and firms are emerging to recycle batteries from electric vehicles, and these show early promise to reduce both toxicity and the need for virgin materials.[65]
Some firms sell carbon offsets to allow consumers a different way to address the CO2 they put into the atmosphere. Thus, rather than reducing their use of fossil fuels, consumers can pay someone to plant trees that will take the CO2 they emit out of the atmosphere. For example, at Terrapass, carbon offsets cost $7.49 for 1,000 pounds of carbon,[66] so it would cost about $75 per year to offset the carbon emissions of a typical car.[67] Trees absorb different levels of CO2 depending on type, size, and age.[68] It requires thousands of trees to absorb the 10,000 pounds of CO2 emitted each year by a typical passenger vehicle.[69]
In terms of increased eco-efficiency, TBL firms like Walmart are rightly praised for converting their transportation systems to electric, reducing energy consumption via LED lighting, and reducing heating and cooling costs via improved building standards.[70] While Walmart has said it seeks to reach zero carbon emissions by 2035, it is noteworthy that this goal does not include its supply chain, which accounts for 95 percent of its climate impact, and that the company has been accused of greenwashing.[71]
Finally, many TBL firms support new subsidies, taxes, and stricter legislation that support non-carbon-based energy, recognizing that this might boost their subsequent business opportunities in green innovation.[72] TBL management is particularly interested in developing competitive new technologies that address consumer demands and create ecologically friendly efficiencies. This includes investment in non–fossil-fuel–based technologies like wind turbines and solar power panels. Other technological ideas to remove carbon from the atmosphere include vast geo-engineering projects: shooting dust into the upper atmosphere to scatter sunlight away from the Earth; reflecting sunlight away from earth by sending a fleet of 55,000 mirrors into space; and pumping liquid CO2 deep into the oceans.[73] These and other methods to slow and potentially reverse climate change are being tested but have not been proven yet to work at scale.
The SET Approach to Energy and the Carbon Economy
SET managers take a more radical approach to ecological well-being. First, a SET approach promotes proactive change, illustrated by the provision of bike lanes and car-sharing services in cities like Copenhagen, Denmark, where 56 percent of the population commutes to their work or place of study by bike, and young adults exert peer pressure on others to not purchase a car. In contrast, consider the fact that about half of all Americans live within 8 kilometers (5 miles) of their work, yet only 11 percent bike and 13 percent use public transit.[74] While cycling may sometimes be less convenient than driving, it enhances positive externalities (e.g., improved personal fitness and health) and reduces negative externalities (e.g., lower GHG emissions, lower healthcare costs). It has been estimated that in terms of externalities, society gains about $0.83 per kilometer traveled by bike rather than by car.[75] When we take into account all the time associated with owning a car and compare it to the total distance we drive, then our average travel speed is about 8 kilometers per hour.[76] In light of these observations, SET firms like Velo Renovation proactively pay employees to commute by bike (see opening case, Chapter 9), while others provide workplace bike garages or bus passes to lower employees’ commuting emissions or offer subsidize e-bike subscriptions for their employees.[77] That said, with requirements for companies operating in the European Union to report “Scope 3 emissions,” which includes reporting GHG emissions related to employee commuting, there may soon be instrumental reasons for all companies to do these things (see Chapter 18).[78]
Second, SET managers listen to and empower a wider variety of stakeholders, in some cases ensuring that the natural environment itself is given a symbolic seat at the decision-making table. The merits of this approach may be more observable in organizations that operate in countries like Norway, where environmental rights are entrenched in its constitution. Organizations operating according to stricter environmental protection and performance standards tend to have smaller ecological footprints. For example, Norway has reduced its air pollution ten times more quickly than countries like Canada have.[79]
Finally, SET management promotes a more place-based consumption and a less energy-intense, consumeristic lifestyle. There is a lot of energy embedded in the products we purchase, much of it related to GHG emissions from international trade. Instead of assuming that more stuff is better, a SET approach assumes that having enough stuff is better, and it promotes place-based businesses and industries aligned with a simpler lifestyle. For example, consider the emerging slow fashion movement. Recall from Chapter 3 that Americans purchase nearly 20 billion garments each year (about fifty-eight garments and seven pairs of shoes per person), of which 98 percent are imported (versus 50 percent in 1990). What if Americans were to purchase only 7 billion garments per year, with each costing three times as much but 98 percent being locally made? Think of the reductions in negative externalities associated with transportation and poor overseas working conditions, think of the benefits to the local economy via the local multiplier effect (Chapter 3),[80] and consider the reduction in waste (fashion accounts for about 10 percent of GHGs). At the same time, think also of the low-paying jobs overseas workers would lose and the reduced choice of products offered to domestic consumers.
SET management is consistent with clothing stores that source at least 90 percent of the products they sell from within 160 kilometers (100 miles) of their location and support sustainable practices such as repairing, reusing, and recycling. Such stores promote local designers and manufacturers who focus on local needs and aesthetics. A SET approach is also evident in a a firm like the like Long Way Homestead, a sheep farm and wool mill in Ste-Geneviève, Manitoba, which allows customers and others to knit sweaters made from local and sustainably produced wool.[81] Local garments can also be made from recycled or natural fabrics (e.g., locally grown hemp) and with the aim of creating slow fashion—that is, high quality clothing that has a timeless style, is designed to last, and is amenable to mixing and matching—rather than fast fashion (also known as “throw-away” fashion). The retail price on slow fashion products will likely be higher, but the hidden price will be much lower.[82] The garments will have a longer useful life, and garment workers could be paid a living wage.[83]
Test Your Knowledge
4.2.3. Food Systems
Food systems are essential for humans to survive and to flourish, and farms have long been (and still are) by far the most common type of organization on the planet. Presently the world has about 570 million small-scale farms (smaller than 2 hectares/5 acres), which produce about one-third of the world’s food and involve about 2.7 billion people.[84] Food systems are important for our physical well-being and also have a large effect on the planet’s ecological well-being.
Humankind has taken over many of the planet’s natural resources for its own purposes, including to feed itself. We now use about 25 percent of the Earth’s total net primary production of natural vegetation, double what we used a century ago.[85] For much of this we can thank industrial agriculture, with its emphasis on technologies like large-scale operations and machinery, plant breeding, fertilizers, and pesticides.[86] Although modern industrial agriculture seems to be very efficient—for example, in Canada and the United States only about 3 percent of the population is involved in growing food—it has actually become increasingly energy inefficient because of its heavy reliance on carbon-based inputs (e.g., fertilizers need to be mined, transported, and applied with machinery). In pre-industrial Wiltshire, England, the ratio between energy inputs and energy outputs in agriculture was about 1:14 (that is, one calorie of manual labor plus animal energy inputs yielded fourteen calories of food energy outputs), but by 1971 that ratio was 1:2.1;[87] today the overall average for industrial agriculture is at best 1:1,[88] and oftentimes 7:1 or 10:1.[89] In short, a large amount of calories (much of it fossil fuel energy) are embedded in the machinery and inputs like fertilizer that enable industrial agriculture to be so productive. Meanwhile, the average ratio in agrarian societies is 1:5 or greater, making them much more energy-efficient.[90]
Earth has about 3.2 billion hectares of arable land, of which only 1.3 billion are moderately or highly productive; the remaining 1.9 billion hectares serve as permanent pasture, forest, or woodland.[91] Modern agriculture practices deplete the carbon and nutrients in the soil so that, for example, the planet may have irreversibly lost more productive land over the past 10,000 years than is currently under agricultural production.[92] The three biggest crops in the world—corn, wheat, and rice—together use about 540 million hectares of land and represent about half of all the calories humankind consumes worldwide.[93] Corn, for example, is about 45 percent carbon and is found in hundreds of foods, especially as a sweetener (as much as 50 percent of the carbon in our body comes from corn).[94] Corn uses far more fertilizers, herbicides, and insecticides than any other crop in the United States, making it the country’s largest contributor to water pollution.[95] The negative externalities associated with nitrogen fertilizers used to grow corn are greater than the total market value of the corn produced for grain ($75 billion).[96] An additional $70 billion of negative externalities are related to US healthcare costs associated with high-fructose corn syrup.[97] Corn is also used to produce ethanol fuel; this drives up global food prices even while ethanol energy provides only marginally more energy than the energy used to grow the corn and process it into fuel.[98]
In addition to using much of the Earth’s plant life, humankind also dominates the animal kingdom. In 2023 Earth was reported to be home to about 27 billion chickens, 1.6 billion cattle, 1.2 billion sheep, and 0.8 billion pigs—sources of the mostly widely consumed animal protein.[99] This leaves fewer natural resources and less room for other animals; for example, between 1970 and 2022 the world’s wildlife populations declined by an average of 69 percent.[100] Cattle and sheep are important to the food system because they are ruminants, which means that they can eat grass and convert it into food (meat) for humankind. Grasses cover about 70 percent of the world’s total land surface, and cattle and sheep can improve the quality of the soil (with their manure, by aerating the soil with their hooves, and by eating the grass on the surface while permitting deep-rooted grass to sequester carbon from the atmosphere).[101] However, most cattle in the United States find their way to concentrated agricultural feeding operations (CAFOs), where an average cow consumes about 800 kilograms (about 50 bushels) of corn before it is slaughtered. In the United States alone, about 3.5 million hectares of land planted in corn are required to feed all the cattle.
Ruminants also produce methane gas (CH4) and account for almost half of all the GHG emissions caused by agricultural production (overall, agriculture emits slightly more global GHG emissions than transportation).[102] It has been estimated that one cow produces about as much GHG per year as driving a combustion engine car, and that 1 kilogram of beef is the equivalent to driving about 250 kilometers, or 155 miles (by way of comparison, 1 kilogram of lamb = driving 125 kilometers, pork = 45 kilometers, and chicken = 33 kilometers).[103] Another study estimates that the $250-billion American beef industry creates $412.5 billion in negative externalities (i.e., for every dollar of revenue, the beef industry creates $1.65 in negative externalities).[104]
Perhaps the greatest danger modern agricultural poses to the planet’s ecological well-being is in the loss of biodiversity, which is approaching rates associated with Earth’s previous mass extinctions, lending support to the argument that we are entering the Anthropocene era.[105] Today, about 75 percent of the world’s food comes from five animal and twelve plant species. This increase in monocultures demands large volumes of external inputs that further negatively impact wildlife.[106] Just as the human body is a complex series of diverse interrelated biological systems, organs, and microorganisms that need to work together in harmony to facilitate our well-being, so also the Earth’s systems and subsystems depend on biodiversity to remain resilient and allow humankind to flourish.[107]
The decline in biodiversity is partly attributable to the increasing concentration of corporate power in industrial agriculture, which decreases variety.[108] For example, 65 percent of all agricultural land globally is farmed by the largest 1 percent of farms (larger than 50 hectares), with mid-size farms (3 to 49 hectares; 15 percent of all farms) using another 23 percent of the land.[109] The two largest seed producers (Bayer and Corteva) control more than half of the market,[110] and the four largest pesticide producers control more than 50 percent of the global market.[111] There are similar concentrations of power among fertilizer producers, food processors, and among the supermarkets and hypermarkets where consumers purchase 45 percent of their groceries.[112]
If all the negative ecological externalities were added to the price of food produced via industrial agriculture practices, the price of food would nearly triple.[113] If consumers were to pay for these externalities it would mean, for example, that instead of food accounting for 6.7 percent of American expenditures on consumer goods, it would account for 20 percent (which is still lower than in most countries in the world).[114] Moreover, adding ecological externalities to the price of food would encourage rethinking mainstream practices in the entire food system and would prompt more sustainable practices that reduce the true net cost of food compared to industrial practices (e.g., recall that industrial agriculture is relatively energy inefficient and contributes at least ten times less to the soil and ecosystems than sustainable practices).
Additionally, if people paid the real price for food, they would be less inclined to waste it. The world produces about 4,600 calories of food per person per day, about half of which are wasted (perhaps because the foodstuff was not harvested properly, is disfigured, or because of lack of adequate storage facilities or damage during transport). In countries like the United States, Canada, Australia, and New Zealand, about 25 percent of the food that people purchase and take home from grocery stores is wasted (e.g., thrown out due to spoilage and leftovers) and another 15 percent is wasted between the farm and grocery store.[115] An estimated 8 percent of the world’s GHG emissions come from food loss and waste production.[116] A 30 percent reduction of food waste at the consumer level could reduce the need for 100 million acres of cropland by the year 2030.[117] If we would respect food more and waste it less, our net food costs would reduce significantly.
FBL Approach to Food Systems
FBL management has shown little concern for the negative ecological externalities associated with producing and transporting food, and often seeks to hide them from view. For example, it is not unusual for agribusinesses that run CAFOs—85 percent of US meat is controlled by just four businesses—to bar journalists and documentary producers from coming to their CAFO and showing the general public what goes on inside.[118] CAFOs have been associated with air and water pollution, improper care for animals, and high energy use.[119] FBL organizations argue that it is the responsibility of government agencies to regulate food systems, and conventional large agribusinesses support and benefit from regulations that provide them with relative competitive advantages.[120] For example, laws in the United States require each farm to have each crop individually certified to comply with food safety regulations. This creates a significant financial disincentive for small farms to plant a variety of crops, even though planting a variety of crops is a healthy agronomic practice.[121] Finally, conventional grocers and food retailers are seek to increase sales and revenues rather than cut down food waste. For example, an FBL minimalist approach to addressing concerns about unhealthy food is evident when ultraprocessed food is sold as “sugar-free” cola or “10% less salt” potato chips.
TBL Approach to Food Systems
TBL management is sensitive to the increasing consumer demand for foods that are perceived to be healthier or more ecologically responsible. For example, in the 1980s “grass-fed beef” was treated as a second-rate, low-cost alternative to “corn-fed beef” (which is a fattier and considered to be a tastier beef), but within fifteen years an active consumer movement coupled with enterprising entrepreneurs had transformed grass-fed beef into a product that demanded a premium price.[122] Today the organic food industry is worth about $64 billion per year in the United States.[123] Grocers like Whole Foods have become successful, thanks to their early-mover advantage in offering the sorts of products that environmentally aware consumers are demanding. More recently, giant grocers like Walmart and Costco have adapted to the market and become leaders in selling organic produce.
The TBL approach encourages efficiency where firms in the industry reduce food waste by, for example, training staff, measuring waste, changing packaging, and improving the management of inventory. One study showed that firms can save $14 for every dollar they invest in such initiatives.[124] Similarly, for every dollar invested to educate consumers about food waste, the household saves $84.[125]
TBL agribusinesses support the kinds of regulations that provide them with relative competitive advantages. For example, the Organic Foods Production Act created a national standard in the United States to certify organic food. When the act was under consideration, there was a struggle between small-scale, place-based producers and large multinational corporations. Multinational corporations—which see organic foods as yet another market to develop and conquer—lobby for standards that permit the inclusion of synthetic ingredients into what is labeled “organic.”[126] Such regulations favor large-scale monocultural producers and often create competitive disadvantages for small-scale polycultural farms that practice a less synthetic approach to organic agriculture.
SET Approach to Food Systems
SET management encourages the proactive adoption of practices that enhance ecological well-being because this is the right thing to do, even if there is not yet a demand for it. This describes farmers like Gabriel Calderon (see opening case), who offered organically grown vegetables and coffee without chemical inputs before consumers at the farmers’ market were asking for it, and cattle farmers who were raising grass-fed beef because it was good for the land.[127]
In addition, SET management also encourages working alongside cutting-edge ecologically minded stakeholders. With its emphasis on PBO, a SET approach is particularly attuned to locavores, which refers to people “whose diet consists only or principally of locally grown or produced food.”[128] This is in contrast to FBL and TBL food systems in places like the United States, where the average forkful of food has traveled over 1,500 kilometers (1,000 miles). The SET approach is particularly attuned to organic locavores. Recall that place-based organic agricultural practices create positive ecological externalities (median = $2,850 per hectare) that are about thirty times greater than practices associated with industrial agriculture (median = $87 per hectare).[129]
There is a difference in consuming organic carrots or grass-fed beef coming from a locally owned farm rather than imported from a large-scale agricultural operation that is 1,500 kilometers away. Not only do the carrots or beef need to be transported shorter distances, but there is a difference in the transaction of selling/purchasing the food when it is grown/consumed by someone from your own community. The food is no longer a mere commodity; it is imbued with a sense of connectedness to place and people. This explains much of the appeal of farmers’ markets, community gardens, and CSAs, where growers and eaters can get to know one another.
A SET perspective is evident in the fast-growing slow food movement, which presents a clear alternative to conventional FBL and TBL industrial agriculture approaches to processed and fast food.[130] Slow food supports local organically grown food where producers earn a fair price for the fruits of their labor. Again, food is more than merely a commodity; its production and consumption are intrinsically related to ecological and social well-being.[131] The slow food movement promotes food that is grown using ecologically sound agronomic practices that encourage biodiversity and is consumed in healthier (less processed) forms in fellowship with others.[132] Similarly, SET perspectives are evident in the growing shift to more plant-based diets,[133] in the recognition that food derived from animals exacts a much higher cost on the environment compared with equivalent nutrients from plants.[134] The SET approach also seeks to reduce ultraprocessed foods, which currently represent about 60 percent of calories consumed in the United States and create negative effects on people’s health, including increases in obesity, vascular diseases, diabetes, cancers and depression.[135]
Test Your Knowledge
4.2.4. Human Physical Health
Human physical health is a third key component of ecological well-being. With some exceptions, the average lifespan and health of people has been increasing over the millennia. One notable exception was at the advent of the first agricultural revolution, about 12,000 years ago, which saw a period of decreased nutrition, stunted growth, and weakened bones as nutrient diversity declined, especially among agricultural societies as compared to hunter-gatherers.[136] However, overall health improved over time owing to advantages brought by the physical security associated with human settlement and agriculture.[137] A second notable exception was during the Industrial Revolution in Britain, which was initially associated with decreased human health, life, and survival, especially in industrial cities.[138] Health eventually improved thanks to higher yields in agriculture, better transport and storage,[139] and discoveries in the medical sciences.
Despite continued improvements in healthcare and pharmaceuticals, there are signs that negative externalities associated with our modern lifestyles may be leading to unintended negative consequences, especially since the 1950s and the start of the Anthropocene.[140] For example, obesity is now a bigger global health crisis than hunger,[141] partly because people are less physically active than they have been in the past, and partly because businesses seek to maximize sales by offering tasty food, even if it is often calorie rich and not particularly healthy (recall that over half the calories consumed in countries like the United States come from ultraprocessed foods). Obesity costs in the United States have been estimated to be as high as $1.4 trillion a year.[142]
The increased use of fossil fuels since the 1950s has contributed not only to concerns about climate change but also to concerns about its negative effects on health. Reducing the use of fossil fuels would decrease emissions of nitrogen oxides, sulfur dioxide, ammonia, and other volatile organic compounds that have serious negative effects on human health. Over 90 percent of the world lives in places that do not meet the air quality guidelines of the World Health Organization, and about one of every eight deaths around the world are a result of air pollution.[143] Asthma and allergy rates have more than doubled in the United States over the past decades, so that today almost 10 percent of children have allergies.[144] A 2016 study found that every dollar spent to double the world’s usage of renewable energy by 2030 would save about $15 in associated costs.[145]
FBL Approach to Human Health
From an FBL perspective, the responsibility of business is to maximize profits, and it is the responsibility of government and other stakeholders with the necessary expertise to pass and enforce legislation that ensures human health and ecological well-being. Thus, FBL organizations tend to ignore (non-legislated) health-related issues, unless ignoring them hurts their financial bottom line. And the societal costs of unhealthy work conditions can be significant, as illustrated by the fact that close to 3 million people around the world die each year from work-related injuries, illnesses, and accidents.[146] We rarely see and thus seldom think about the working conditions in the overseas factories that produce our goods.
Moreover, an FBL approach encourages businesses to pursue profitable activities, even if there are known significant health problems. For example, even though smoking cigarettes is known to cause cancer, the FBL approach encourages selling cigarettes if doing so is profitable for a firm and within the law. Consistent with this, cigarette manufacturers have continued to profitably sell their addictive products, even though they cause three of ten cancer deaths in the United States.[147] Cigarette manufacturers have been accused of obstructing the ability of consumers and others to access research that demonstrates the extent of tobacco’s harm to human health.[148]
Another example comes from the food industry, where research suggests that the pesticide chlorpyrifos causes brain damage, and scientists at the US Environmental Protection Agency concluded that it should be banned. However, lawyers representing pesticide manufacturers like Dow have lobbied federal agencies to ignore the science that shows the negative effects of chlorpyrifos,[149] and today it remains in wide use on crops such as strawberries, oranges, apples, and broccoli.
That said, FBL firms may also engage in minimalist actions that have the appearance of safeguarding for the health of others but have only limited impact, such as promoting their planned implementation of new workplace standards supported by a third party, or engaging in a tree-planting event outside of their factories.
TBL Approach to Human Health
TBL management responds to consumer interests in enhancing physical health where it can profitably do so. For example, after finding out that younger customers want healthier food options with fresh ingredients, McDonald’s pledged to remove antibiotics from its chicken products.[150] However, the highly processed foods that McDonald’s serves have been linked to obesity and diabetes.[151] There are also many negative externalities related to the industrial beef industry, including its reliance on antibiotics and growth hormones, and the consumption of about 3.5 million hectares (35,000 square kilometers) of US-grown, ecologically demanding corn.[152]
When TBL firms provide employees with the option of working at smart or standing desks it can be seen as an efficient way to nurture employees’ health by maintaining productivity while also possibly lowering employees’ risk of obesity and heart disease.[153] Firms whose CEOs have a regulatory focus associated with a “do no harm” orientation (reduce negative externalities) will have fewer workplace injuries.[154]
SET Approach to Human Health
The SET approach is the most deliberate and proactive in promoting physical health, even without a business case to do so. In particular, a SET approach supports three key ways of improving physical health while simultaneously enhancing ecological well-being. First, physical well-being can be improved by becoming more active and in particular, by using our own energy instead of carbon-based fuels to get around. This means walking or cycling to places where we might normally drive, which would reduce GHG emissions and air pollution. SET organizations like Velo facilitate active lifestyles by paying employees to commute by bike, other firms provide showers for employees who cycle or run to work, and some firms develop and promote products that encourage physical activity (e.g., pedal-powered velomobiles and local courier services that use bikes). Other initiatives that promote health include having walking meetings, fitness centers at work, and company sports leagues. Some firms even help to develop and maintain local hiking trails for employees and the larger community to enjoy
Second, physical well-being can be improved through better diet.[155] This is supported by the slow food movement, which aligns with SET values and includes eating less processed food (especially refined sugars and fats), eating more fruits and vegetables, and eating organically grown food in order to reduce intake of chemicals like chlorpyrifos. Life-cycle assessments show that eating more plants and less meat is healthier for our bodies and for the planet (e.g., a vegan diet could reduce agriculture-based GHG emissions by 50 percent and land use by 45 percent).[156] The SET approach also promotes the start-up of place-based organic restaurants, bakeries, and grocery stores, making it easy and convenient for people to eat healthier food. Some firms work together with nutritionists and local farmer to provide health food options in the company cafeteria.
Third, people can improve their health by avoiding illness-causing activities and stimuli. In this regard, SET management promotes the precautionary principle, which states that before anyone undertakes an action that has a reasonable risk of harming others or the environment, that person must demonstrate that the action is not harmful. It is insufficient to engage in such actions on the basis that there is no evidence that proves them to be harmful.[157] While adoption of the precautionary principle may slow the pace of some innovation, it may also encourage people to become more innovative with proven technologies. For example, from a SET perspective, chlorpyrifos should not be used. Nor, for that matter, should many other biocides, pesticides, endocrine disruptors, and heavy metals. Only 1 percent of the 84,000 chemicals that people come into contact with every day have ever been tested. Along the same lines, SET firms may be the most likely to ban perfumes and colognes, recognizing their possible negative effects on human health.[158] The precautionary principle is especially important in light of research that suggests that exposure to chemicals has a negative effect on children’s IQ.[159] Indigenous people are leaders in modeling the precautionary principle. For example, the Iroquois Nation is known for the “seven generations rule,” which requires decision-makers to take into account the effects of their decisions seven generations into the future. The principle is evident in contemporary decisions being made by American Indigenous peoples about sustainable energy.[160]
Test Your Knowledge
4.3. Entrepreneurial Implications
Finding inventive ways to draw resources from the natural environment to meet our needs has been a preoccupation of humankind in the hunting and gathering era, in the first agricultural revolution, and in the modern industrial era. What has changed is that we as a species have grown in size and technological know-how so that today we are transforming the natural environment to such an extent that we are in danger of ushering in the Anthropocene. A changing business environment with increasing emphasis on ecological well-being enhances opportunities for TBL and SET entrepreneurs but places FBL entrepreneurs at a relative disadvantage.[161] Entrepreneurs can accelerate, reduce, or reverse negative ecological externalities, depending on the decisions they make.
4.3.1. FBL Entrepreneurship and Ecological Well-Being
FBL entrepreneurs feel free to use natural resources in ways that maximize financial well-being without taking negative ecological externalities into account, because they see the latter as the job for governments and others. FBL intrapreneurial opportunities are evident when firms export their GHG- and pollution-causing activities to overseas countries that have lower emission standards or where standards are not enforced.[162] One estimate suggests that 100,000 people in China die each year as a result of pollution that comes from manufacturing goods for Europe and the United States.[163] The FBL approach is also evident when recycling of the world’s electronic waste—such as old computers—is done by small-scale entrepreneurs in countries like India that have lax enforcement of environmental standards and where toxic chemicals enter the atmosphere, the soil, and the bodies of unprotected workers.[164]
Perhaps the best contemporary example of FBL entrepreneurship comes from the oil sands of Alberta, Canada, a country with a long history of entrepreneurs who have exploited its rich natural environment to create economic opportunities.[165] Alberta’s city of Calgary is a veritable entrepreneurial community, with 15 percent of its population self-employed.[166] About two-thirds of Calgary’s entrepreneurship has been related to the energy industry, and its entrepreneurial culture is described as one of “wealth creation,” where 42 percent of entrepreneurs are looking to “maximize their short-term personal profit rather than long-term sustainability.”[167]
While there is a lot of money to be made, the oil sands have been called “the most destructive project on Earth” by Environmental Defence, a Canadian non-government organization (NGO), and “the most toxic fossil fuel on the planet” by the Sierra Club, a US-based NGO.[168] The GHG emissions from extracting and upgrading bitumen (which is like a mixture of tar and sand) from Alberta’s oil sands are about four times higher than for conventional crude oil.[169] This has contributed to a long debate about whether pipelines should be built to connect the oil sands to the United States and other markets.
4.3.2. TBL Entrepreneurship and Ecological Well-Being
TBL entrepreneurs seek profitable opportunities to respond to increased consumer demand for ecologically friendlier goods and services. For example, Suncor and other TBL businesses in the Alberta oil sands have been developing new technologies in carbon capture and storage to reduce GHG emissions into the atmosphere.
Consider also the opportunities in the food industry, as people have become more aware of and concerned about the negative externalities of conventionally raised meat. About 10 percent of Americans do not eat meat,[170] and of the remainder 37 percent say they want to eat less red meat.[171] Some entrepreneurs are promoting ecologically friendlier meat alternatives, including 3D-printed meat and producing synthetic meat grown in a lab.[172] Pat Brown, founder of Impossible Foods—a company that creates meat-like products from plants—implores venture capitalists to hire scientists, “do the math,” and fund more ecologically responsible start-ups.[173] Entrepreneurs in the fast food industry have also taken notice, with healthier options being added to the menus of traditional chains, and the start-up and growth of new fast food restaurants that promote healthy options. For example, Sweetgreen, whose mission is “Building healthier communities by connecting people to real food,” was started in 2005 by three college students with “a vision to reimagine fast food.” It has over 200 locations and annual revenues surpassing $500 million.[174]
TBL entrepreneurs are adept at using messaging and marketing to profitably manage and shape markets to serve their financial interests. For example, sales of vegetable dishes in a university cafeteria increased by 25 percent when they were given exciting names like “dynamite beets,” “sizzlin’ beans,” and “twisted citrus-glazed carrots.”[175] Another example comes from the history of the tobacco industry. When cigarettes were deemed unhealthy for both smokers and those affected by second-hand smoke, intrapreneurial cigarette manufacturers like Philip Morris introduced and promoted new “healthier” filter and low-tar cigarettes. A third example comes from the bottled beverage industry, where firms cooperate to shape public opinion in their favor. Keep America Beautiful (KAB)—a TBL organization associated with the promotion of sustainability—was created in 1953 by a group of companies that produced and sold disposable beverage containers.[176] KAB coined the term “litterbug” and worked hard to create the perception that pollution should be addressed at the consumer level rather than by reducing the number of disposable beverage containers being manufactured and sold.
When PepsiCo’s Naked Juice became the first national brand to use a plastic bottle made from 100 percent post-consumer recycled polyethylene—an example of intrapreneurship—it launched a program where it would donate up to five cents per bottle to KAB.[177] While the TBL optics are positive, we should not overlook the fact that 86 percent of the 60 million plastic bottles used in the United States every day end up in landfills, where they can take up to 700 years to decompose. The energy used every year to manufacture, transport, and then dispose of these plastic bottles amounts to the equivalent of about 16 million barrels of oil, which is enough fossil fuel to drive more than 100,000 cars for a year.[178]
4.3.3. SET Entrepreneurship and Ecological Well-Being
The SET approach recognizes that if humankind is to survive as a species, we need to ensure that we respect and work within the boundaries that define the sustainable ecological niche for our planet.[179] Such a SET approach is evident in this chapter’s opening case, where we saw how Gabriel Calderon shifted coffee production from commercial export markets to niche local sales (thereby reducing GHG emissions), while also eliminating the chemical inputs that are used in most coffee plantations around the world to achieve viable coffee at commercial scale. Calderon replaced pesticides, herbicides, and fertilizers by shifting from monocropping to intercropping and integrated pest management. In addition, intrapreneurial experimentation enabled him to discover attractive uses for what is typically considered waste in coffee processing: wine and “tea” is made from the skin of the coffee cherry, baking flour and pudding from the pulp, and the dry coffee beans are roasted using the combustion energy of the hull and husk . Finally, these entrepreneurs have embarked on an education and awareness campaign to share their experiences with other farmers.
Other examples where glimpses of SET entrepreneurship is evident include local farmers’ markets, wind farms that provide a source of renewable energy to replace fossil fuels, and courier companies that use bikes instead of cars (thereby reducing GHG emissions and pollution, and enhancing physical fitness of employees). SET ideas are also evident in a start-up like CityTree’s large “green cube” that is filled with moss and reduces air pollution by the same amount as 275 regular trees,[180] and in entrepreneurs who are making shoes using harmful algae that has been harvested to restore polluted lakes.[181]
Test Your Knowledge
Chapter Summary
- As a result of economic activity and the proliferation of fossil fuel–based technologies, scientists have documented that humankind is now living beyond the biocapacity of the planet and the Earth’s ecosystems that support ecological well-being are in jeopardy.
- Carbon has long been the key currency of how humans produce goods and services. High-energy carbon molecules provide the energy that fuels our machines, our food systems, and our bodies. Unfortunately, the carbon we use in fossil fuels and draw from the Earth has entered the atmosphere at rates that photosynthesis in plants and the ocean’s plankton cannot sequester, upsetting the balance in the carbon cycle that has been in place for millennia. In addition, the scale of humankind’s use of plant and animal life is reducing biodiversity, which decreases planetary resilience and contributes to anthropocentric extinction threats. Pollutants from fossil fuels and the consumption of profitable (but unhealthy) foods are threatening human and planetary health.
- There are three basic approaches to managing ecological well-being:
- FBL managers are unaware of or deny negative ecological externalities, obstruct stakeholders who seek to monitor their ecological impacts, and meet the lowest legal standards in terms of ecological conservation.
- TBL managers are responsive to consumer demand for products and services that create fewer negative ecological externalities in a profitable way, seek to use natural resources more efficiently and thus more cost-effectively, and support regulations that are favorable to their business interests.
- SET managers seek to enhance ecological well-being via proactive, stakeholder-centric, and place-based organizing.
- A changing environment with increasing emphasis on ecological well-being enhances opportunities for TBL and SET entrepreneurship, and places FBL entrepreneurs at a relative disadvantage.
Questions for Reflection and Discussion
- Do you think human-caused climate change is real? Do you think humankind needs to reduce its use of carbon-based fuels? Do you think we need to address negative externalities in our industrial food systems? What sort of evidence would convince you that transformational change is, or is not, needed for each of these three issues?
- How important is it for managers to acquire a basic understanding of how the Earth’s ecological systems work (e.g., the carbon cycle)? Should business schools require students to take courses in environmental studies, or is it already challenging enough for management students to learn about the business functions like accounting, marketing, and finance? What are the dangers of business leaders being unaware of how ecological systems work?
- Can you imagine a lifestyle where you reduce by 50 percent the fossil fuels you consume by doing things like eating more organically grown food, halving your food waste, purchasing half as many clothes as you do now, reducing by half the trips you take in a car, living in a home with half as much space per person, and so on? What would be the most difficult changes for you to make, and why? What would be the easiest changes to make, and why? Can you think of any entrepreneurial opportunities that would make such changes more compelling and easier for others?
- Would you shop at a clothing store or restaurant that sources at least 90 percent of its inputs from within 161 kilometers (100 miles) of where it is located? Why or why not?
- List the five most significant ecological challenges you think are facing humankind over the next thirty years (they need not be mentioned in this chapter). Briefly indicate the evidence you used to reach your conclusion. Then identify at least five things you could do in your career to address at least one of the challenges. How important are entrepreneurial skills to implementing your list?
- What is the precautionary principle? Do you think it is reasonable for businesses to be bound by it? Explain your reasoning.
- Discuss the advantages and disadvantages of place-based organizing. On balance, is it a good idea?
- The previous chapter compared acquisitive versus sustenance economics, and documentational versus relational capitalism. Do you think that either form of economics or capitalism is more likely to improve (or worsen) ecological well-being? Explain your reasoning. What are the implications for your career?
- Of all the ecological issues listed in this chapter, which one(s) are you personally most interested in addressing? Can you think of any entrepreneurial ideas for how they might be addressed? Develop a list of five ideas for a new start-up organization that addresses the ecological challenges facing humankind. Make sure at least one of your ideas is based on a SET approach.
- S&P Global. (2024, August 9). Coffee market analysis. https://www.spglobal.com/commodityinsights/en/ci/products/food-commodities-food-manufacturing-softs-coffee.html#:~:text=Coffee is commercially produced in,estimated to exceed 0 billion. Unless otherwise noted, all dollar amounts in this chapter are in US currency. ↵
- Macrotrends. (2024, August 9). Starbucks revenue 2021–2024 | SBUX. https://www.macrotrends.net/stocks/charts/SBUX/starbucks/revenue#:~:text=Starbucks revenue for the twelve,a 10.98% increase from 2021.. ↵
- S&P Global (2024); Fairtrade Foundation. (2024, August 9). Coffee farmers. https://www.fairtrade.org.uk/farmers-and-workers/coffee/#:~:text=Coffee is one of the,on coffee for their livelihoods. ↵
- Balance Coffee. (2024, August 9). Coffee consumption statistics. https://balancecoffee.co.uk/blogs/blog/global-coffee-consumption-statistics#:~:text=What Percentage Of People Drink,people) love drinking coffee daily ↵
- Lestari, W., Hashballah, K., Listiawan, M., Sophia, S. (2022, February 23). Coffee by-products as the source of antioxidants: A systematic review. F1000Research, 11(120). https://doi.org/10.12688/f1000research.107811.1 ↵
- Purity Coffee. (2024, August 9). What’s better than organic coffee? Organic, specialty grade coffee! https://puritycoffee.com/blogs/blog/what-is-specialty-grade-organic-coffee#:~:text=To qualify as specialty grade,1% is specialty grade organic ↵
- International Coffee Organization. (2023, April). Coffee report and outlook (CRO). https://icocoffee.org/documents/cy2022-23/Coffee_Report_and_Outlook_April_2023_-_ICO.pdf; National Coffee Association. (2024, August 9). Coffee regions of the world. https://www.ncausa.org/About-Coffee/Coffee-Around-the-World#:~:text=Brazil,bodied, and low-acid ↵
- Many people are becoming more aware of the negative ecological externalities associated with disposable coffee cups, which annually result in the loss of about 6.5 million trees and require the energy to power over 50,000 homes. See GreenMatch. (2023, May 11). The effects of paper coffee cups on the environment. GreenMatch Blog. https://www.greenmatch.co.uk/blog/2015/06/the-effects-of-paper-coffee-cups-on-the-environment; Nowell, C. (2024, January 22). The disposable cup crisis: What’s the environmental impact of a to-go coffee? The Guardian. https://www.theguardian.com/environment/2024/jan/22/disposable-coffee-cups-environmental-impact ↵
- Note that for human life to genuinely flourish, the other forms of life in the ecosystem also need to flourish. Note also that there are what we might term “counterfeit” understandings of what it means for human life to flourish. For example, we might think that humans would flourish better if we got rid or mosquitoes—and perhaps we might—but that could also trigger other problems in the ecosystem. See Shelami, Matan on Quora. (2017, September 13). What would happen if we eliminated the world’s mosquitoes?. Forbes. https://www.forbes.com/sites/quora/2017/09/13/what-would-happen-if-we-eliminated-the-worlds-mosquitoes/#27448ff511f6 ↵
- Richardson, K., Steffen, W., Lucht, W., Bendtsen, J., Cornell, S. E., Donges, J. F., . . . Rockström, J. (2023, September 13). Earth beyond six of nine planetary boundaries. Science Advances, 9(37). https://www.science.org/doi/10.1126/sciadv.adh2458 ↵
- Richardson et al. (2023). ↵
- Steffen, W., Broadgate, W., Deutsch, L., Gaffney, O., & Ludwig, C. (2015). The trajectory of the Anthropocene: The Great Acceleration. The Anthropocene Review, 2(1): 81–98. https://doi.org/10.1177/2053019614564785; Angus, I. (2016). Facing the Anthropocene: Fossil capitalism and the crisis of the Earth system. Monthly Review Press. ↵
- The US Environmental Protection Agency and the European Environment Agency provide a similar definition: “The complex of atmospheric, geological and biological characteristics found in an area in the absence of artifacts or influences of a well developed technological, human culture.” US Environmental Protection Agency. (2018, April). EPA enterprise vocabulary. https://sor.epa.gov/sor_internet/registry/termreg/searchandretrieve/enterprisevocabulary/search.do?search=&tierTwoSelected=1006444&searchString= ↵
- Wackernagel, M., Schulz, N. B., Deumling, D., Linares, A. C., Jenkins, M., Kapos, V., . . . Randers, J. (2002). Tracking the ecological overshoot of the human economy. Proceedings of the National Academy of Sciences, 99(14): 9266–9271. http://dx.doi.org/10.1073/pnas.142033699 ↵
- Galli, A., Lin, D., Wackernagel, M., Gressot, M., Winkler–Global, S., & Network, F. (2016). Humanity’s growing ecological footprint: sustainable development implications (Brief for GSDR 2015). United Nations. https://sustainabledevelopment.un.org/content/documents/5686humanitysgrowingecologicalfootprint.pdf ↵
- Toth, G., & Szigeti, C. (2016). The historical ecological footprint: From over-population to over-consumption. Ecological Indicators, 60(1): 283–291. http://dx.doi.org/10.1016/j.ecolind.2015.06.040; Moore, J., & Rees, W. E. (2013). Getting to one-planet living. In Worldwatch Institute, State of the world 2013: Is sustainability still possible? (Chapter 4, pp. 39–50). Island Press. ↵
- Galli et al. (2016). ↵
- Makower, J., et al. (2020). 2020 State of green business. GreenBiz Group. ↵
- More specifically, 76 percent is industrial waste, 18 percent is special waste, 3.5 percent is construction and demolition waste, and less than 3 percent is garbage (municipal solid waste). Leonard, A. (2013). Moving from individual change to societal change. In Worldwatch Institute, State of the world 2013: Is sustainability still possible? (Chapter 23, pp. 244–252). Island Press. ↵
- McMahon, J. (2014, October 12). What would Milton Friedman do about climate change? Tax carbon. Forbes. https://www.forbes.com/sites/jeffmcmahon/2014/10/12/what-would-milton-friedman-do-about-climate-change-tax-carbon/#53166e306928 ↵
- Kiron, D., Kruschwitz, N., Rubel, H., Reeves, M., & Fuisz-Kehrback, S. K. (2013, December). Sustainability’s next frontier: Walking the talk on the sustainability issues that matter most (Findings from the 2013 Sustainability and Innovation Global Executive Study and Research Project). MIT Sloan Management Review and The Boston Consulting Group. https://sloanreview.mit.edu/projects/sustainabilitys-next-frontier/ ↵
- Grist, & Winters, J. (2025, January 23). If you think Big Oil is trying to manipulate you on social media—you’re right. Fast Company. https://www.fastcompany.com/91264721/if-you-think-big-oil-is-trying-to-manipulate-you-on-social-media-youre-right ↵
- Tan, C. E., Kyriss, T., & Glantz, S. A. (2013). Tobacco company efforts to influence the Food and Drug Administration-commissioned Institute of Medicine report Clearing the Smoke: An analysis of documents released through litigation. Public Library of Science Medicine, 10(5): e1001450. https://doi.org/10.1371/journal.pmed.1001450; Schick, S., & Glantz, S. (2005). Scientific analysis of second-hand smoke by the tobacco industry, 1929–1972. Nicotine Tobacco Research, 7(4): 591–612. http://dx.doi.org/10.1080/14622200500185082 ↵
- Lasart, D. (2023, June 27). A Volkswagen board member was convicted in the Dieselgate scandal that’s costing billion and counting. Quartz. https://qz.com/volkswagen-dieselgate-scandal-rupert-stadler-audi-1850581201 ↵
- US Environmental Protection Agency. (2024, May 7). Willamette Industries wood products settlement. https://www.epa.gov/enforcement/willamette-industries-wood-products-settlement ↵
- PDI Technologies. (2023, April 26). Report finds Americans willing to pay more for sustainable products. https://pditechnologies.com/news/consumers-willing-pay-more-sustainability/ ↵
- For more information on sustainable marketing, see Martin, D., & Schouten, J. (2012). Sustainable marketing. Prentice-Hall; for the Greenwashing Index, see https://www.greenwashingindex.com ↵
- Carbon taxes encourage the development of greener technologies. “In a recent barrage of public letters and full-page ads, Fortune 100 companies are voicing strong support for remaining in the Paris accord. The breadth of this coalition is remarkable: industries from oil and gas to retail, mining, utilities, agriculture, chemicals, information and automotive. This is as close as big business gets to a consensus position. . . . American business leaders understand that remaining in the agreement would spur new investment, strengthen American competitiveness, create jobs, ensure American access to global markets and help reduce future business risks associated with the changing climate. Leaving Paris would yield the opposite.” Shultz, G. P., & Halstead, T. (2017, May 9). The business case for the Paris Climate Accord. The New York Times. https://www.nytimes.com/2017/05/09/opinion/the-business-case-for-the-paris-climate-accord.html?emc=edit_th_20170509&nl=todaysheadlines&nlid=50700384 ↵
- Tax Foundation. (2024, August 13). Carbon tax. https://taxfoundation.org/taxedu/glossary/carbon-tax/#:~:text=A carbon tax is levied,to produce less of them. ↵
- Some businesses and individuals already voluntarily pay for “carbon offsets” to account for their use of fossil fuels—green taxes would ensure that everyone pays for the ecological damage that their actions cause. ↵
- Underwood, A. (2007, August 15). American campuses get greener than ever. Newsweek. https://www.newsweek.com/american-campuses-get-greener-ever-99123 ↵
- Friedman, T. L. (2005). The world is flat: A brief history of the twenty-first century. Farrar, Straus and Giroux. ↵
- Shrivastava, P., & Kennelly, J. J. (2013). Sustainability and place-based enterprise. Organization & Environment, 26(1): 83–101. https://doi.org/10.1177/1086026612475068 ↵
- Shrivastava & Kennelly (2013); McCaffrey, S. J., & Kurland, N. B. (2015). Does “local” mean ethical? The US “buy local” movement and CSR in SMEs. Organization & Environment, 28(3): 286–306. https://doi.org/10.1177/1086026615586795. Compared to large and multinational firms, small- and medium-sized firms are less likely to be profit-maximizers. ↵
- Patel, R. (2010). The value of nothing: How to reshape market society and redefine democracy. Picador; Sandhu, H. S., Wratten, S. D., Cullen, R., & Case, B. (2008). The future of farming: The value of ecosystem services in conventional and organic arable land. An experimental approach. Ecological Economics, 64(4): 835–848. http://dx.doi.org/10.1016/j.ecolecon.2007.05.007 ↵
- Carolan, M. (2014). Cheaponomics: The high cost of low prices. Routledge. ↵
- Charisi, V., Zafeiroudi, A., Trigonis, I., Tsartsapakis, I., & Kouthouris, C. (2025). The impact of green spaces on workplace creativity: A systematic review of nature-based activities and employee well-being. Sustainability, 17(2): 390. https://doi.org/10.3390/su17020390 ↵
- For a review of this literature, see Capaldi, C. A., Passmore, H. A., Nisbet, E. K., Zelenski, J. M., & Dopko, R. L. (2015). Flourishing in nature: A review of the benefits of connecting with nature and its application as a wellbeing intervention. International Journal of Wellbeing, 5(4): 1–16. http://dx.doi.org/10.5502/ijw.v5i4.1. This review refers to various studies on the benefits of being connected to nature: Leary, M. R., Tipsord, J. M., & Tate, E. B. (2008). Allo-inclusive identity: Incorporating the social and natural worlds into one’s sense of self. In H. A. Wayment & J. J. Bauer (Eds.), Transcending self-interest: Psychological explorations of the quiet ego (pp. 137–147). APA. The benefits of connectedness to nature can be induced by doing something as simple as walking in nature, which increases positive affect and reduces stress and anger: Hartig, T., Evans, G. W., Jamner, L. D., Davis, D. S, & Gärling, T. (2003). Tracking restoration in natural and urban field settings. Journal of Environmental Psychology, 23(2): 109–123. https://psycnet.apa.org/doi/10.1016/S0272-4944(02)00109-3. See also Lee, J., Tsunetsugu, Y., Takayama, N., Park, B. J., Li, Q., Song, C., . . . Miyazaki, Y. (2014, February 10). Influence of forest therapy on cardiovascular relaxation in young adults. Evidence-Based Complementary and Alternative Medicine. http://dx.doi.org/10.1155/2014/834360; Davis, J. L., Green, J. D., & Reed, A. (2009). Interdependence with the environment: Commitment, interconnectedness, and environmental behavior. Journal of Environmental Psychology, 29(2): 173–180. http://dx.doi.org/10.1016/j.jenvp.2008.11.001 ↵
- Patel (2010). ↵
- Though some have argued that the transportation savings may not be as great as generally thought. Torrella, K. (2022, June 6). The environmental limits of eating local. Vox. https://www.vox.com/future-perfect/23132579/eat-local-csa-farmers-markets-locavore-slow-food ↵
- This is consistent with the saying “You cannot get rich in a small town because there are too many people watching” that Galen Lehman observed on a sign in Kidron, Ohio. That said, it is also true that, for example, local farms may hire migrant workers to work under poor conditions. Hinrichs, C. C., & Allen, P. (2008). Selective patronage and social justice: Local food consumer campaigns in historical context. Journal of Agricultural and Environmental Ethics, 21(4): 329–352. https://doi.org/10.1007/s10806-008-9089-6 ↵
- For an excellent overview of the global carbon cycle, see University of New Hampshire. (2009). An introduction to the global carbon cycle. http://globecarboncycle.unh.edu/CarbonCycleBackground.pdf ↵
- Levin, D. (2012, September 6). Follow the carbon. Oceanus. http://www.whoi.edu/oceanus/feature/follow-the-carbon. As noted by Stephen Hawking: “What we normally think of as ‘life’ is based on chains of carbon atoms, with a few other atoms such as nitrogen or phosphorous. . . . The Earth was formed largely out of the heavier elements, including carbon and oxygen. Somehow some of these atoms came to be arranged in the form of molecules of DNA.” Page 308 in Hawking, L., & Hawking, S. (2014). George and the unbreakable code. Simon & Schuster. ↵
- This section has benefitted from comments by Scott Kroeker, University of Manitoba. ↵
- Schwartz, J. D. (2014, March 4). Soil as carbon storehouse: New weapon in climate fight? Yale Environment 360. http://e360.yale.edu/features/soil_as_carbon_storehouse_new_weapon_in_climate_fight ↵
- Joshi, P. K. (2011). Conservation agriculture: An overview. Indian Journal of Agricultural Economics, 66(1): 53–63. https://www.researchgate.net/publication/285929130_Conservation_agriculture_An_overview ↵
- According to John Revington (World Rainforest Report), 40 percent of rainforests in Central America have been burned down or cleared since 1950, mostly to use as cattle pasture for the export market (often for American hamburgers). Cited on page 13 of Meat: Now, it’s not personal! (2004, July/August). World Watch Magazine, 17(4): 12–20. https://www.scribd.com/document/8058293/Is-Meat-Sustainable ↵
- Houghton, R. A., Hobbie, J. E., Melillo, J. M., Moore, B., Peterson, B. J., Shaver, G. R., & Woodwell, G. M. (1983). Changes in the carbon content of terrestrial biota and soils between 1860 and 1980: A net release of CO2 to the atmosphere. Ecological Monographs, 53(3): 235–262. https://doi.org/10.2307/1942531 ↵
- Statista Research Department. (2024, April 30). Petroleum consumption in the United States in selected years from 1990 to 2023, by sector. Statista. https://www.statista.com/statistics/244442/us-petroleum-energy-consumption-by-sector/. For further discussion of energy politics and enslaved labor, see Nikiforuk, A. (2012). The energy of slaves: Oil and the new servitude. Greystone. ↵
- The total market capitalization of global financial institutions is about .5 trillion, while the market value of state- and privately-owned oil and gas firms is .7 trillion. Di Muzio, T. (2016). Energy, capital as power and world order. In Cafruny, A., Talani, L. S., Martin, G. P. (Eds.), The Palgrave Handbook of Critical International Political Economy (pp. 267–287). Palgrave Macmillan. https://doi.org/10.1057/978-1-137-50018-2_14 ↵
- Boden, T. A., Marland, G., & Andres, R. J. (2010). Global, regional, and national fossil-fuel CO2 emissions. Carbon dioxide information analysis center. US Department of Energy. ↵
- When trees are felled, or burned, or even when they decompose, they release CO2 into the atmosphere: “Approximately 50% of a tree's weight can be traced back to carbon that originated from atmospheric carbon dioxide.“ EarthLabs. (2011, July 7). Deforestation and the climate cycle. Science Education Resource Center, Carleton College. https://serc.carleton.edu/eslabs/carbon/lab4.html ↵
- Le Quéré, C., Andrew, R. M., Canadell, J. G., Sitch, S., Korsbakken, J. I., Peters, G. P, . . . Keeling, R. F. (2016). Global carbon budget 2016. Earth System Science Data, 8(2): 605-649. https://doi.org/10.5194/essd-8-605-2016 ↵
- See on NASA’s award-winning website: NASA. (n.d.). Global climate change: Vital signs of the planet. https://science.nasa.gov/climate-change/; and NASA. (n.d.). Carbon dioxide. Retrieved July 11, 2024, from https://climate.nasa.gov/vital-signs/carbon-dioxide/?intent=111. Note that CO2 levels may have been as much as 1,000 parts per million in pre-human eras. Scientists believe that such levels today would make the planet unsustainable for humankind. ↵
- Ritchie, H., & Roser, M. (2024, January). CO2 emissions: How much CO2 does the world emit? Which countries emit the most? https://ourworldindata.org/co2-emissions; Our World in Data. (n.d.). Change in CO2 emissions and GDP. Retrieved July 7, 2024, from https://ourworldindata.org/grapher/co2-emissions-and-gdp?country=USA~OWID_EU27~OWID_WRL ↵
- Poynting, M., Rivault, E., & Dale, B. (2025, Jan 9). 2024 first year to pass 1.5C global warming limit. BBC. https://www.bbc.com/news/articles/cd7575x8yq5o ↵
- There are many sources of such information, but in this section much of the information is from NASA. (n.d.). Carbon dioxide. That said, there are climate skeptics who often note that temperature variation has a long history on Earth, demonstrating that there are non-anthropocentric reasons for climate change. Vulpe, S.-N. (2024). Cooling down the future: A discourse analysis of climate change skepticism. The Social Science Journal, 61(1): 256–272. https://www.tandfonline.com/doi/abs/10.1080/03623319.2020.1848294 ↵
- Evans, J. (2017, March 22). Sea ice extent sinks to record lows at both poles. NASA. https://www.nasa.gov/feature/goddard/2017/sea-ice-extent-sinks-to-record-lows-at-both-poles ↵
- NASA. (n.d.). Is the rate of sea-level rise increasing? Retrieved July 6, 2024, from https://sealevel.nasa.gov/faq/8/is-the-rate-of-sea-level-rise-increasing/ ↵
- Casey, A. (2022, May 20). Megacities, megarisks: How population growth and climate change increase vulnerability in the world’s largest cities. Population Connection. https://populationconnection.org/blog/megacities-population-growth-climate-change/ ↵
- Doney, S. C., Fabry, V. J., Feely, R. A., & Kleypas, J. A. (2016). Ocean acidification: The other CO2 problem. Washington Journal of Environmental Law & Policy, 6(2): 213. https://digitalcommons.law.uw.edu/cgi/viewcontent.cgi?article=1055&context=wjelp ↵
- Thompson, H. (2015, May 26). How will climate change impact plankton? Smithsonian Magazine. http://www.smithsonianmag.com/smart-news/how-will-climate-change-impact-plankton-180955387/; World Wildlife Fund. (2016). Living planet report 2016: Risk and resilience in a new era. https://c402277.ssl.cf1.rackcdn.com/publications/964/files/original/lpr_living_planet_report_2016.pdf?1477582118&_ga=1.148678772.2122160181.1464121326; Kirby, A. (2013, September 7). Plankton will suffer as oceans warm. The Energy Mix. https://www.theenergymix.com/plankton-will-suffer-as-oceans-warm/ ↵
- Martinez, C. Kilbury, L., Martinez. J., White, Cl., Lutz, M., So, K., . . . Christianson, A. (2023, December 3). These fossil fuel industry tactics are fueling democratic backsliding. CAP (Center for American Progress). https://www.americanprogress.org/article/these-fossil-fuel-industry-tactics-are-fueling-democratic-backsliding/ ↵
- US Environmental Protection Agency. (2024, May 14). Carbon pollution from transportation. https://www.epa.gov/transportation-air-pollution-and-climate-change/carbon-pollution-transportation ↵
- Battery recycling is advancing rapidly, both in percentage of waste captured and percentage of raw materials recovered from each battery. Unlike for most recycling, the constituent elements in a battery become more pure and therefore more valuable with each round of processing. One prominent leader in batter recycling is Redwood Materials: https://www.redwoodmaterials.com/ ↵
- See Terrapass. (n.d.). Restore the balance. https://terrapass.com/homepage/ ↵
- See US Environmental Protection Agency. (2023, August 28). Greenhouse gas emissions from a typical passenger vehicle. https://www.epa.gov/greenvehicles/greenhouse-gas-emissions-typical-passenger-vehicle-0 ↵
- Values of carbon sequestration of common trees (without differentiating by size), use the information in the following table taken from Schulz, C. (2023, February 24). How much CO2 does a tree absorb per year? ForTomorrow. https://www.fortomorrow.eu/en/blog/co2-tree. On average a tree stores 24.62 kilograms of CO2 per year; at CDN[lxviii].41 per kilogram, that equals .09 per year. Oak18.87 kg CO2/yearBeech15.89 kg CO2/yearSpruce20.13 kg CO2/yearFir20.72 kg CO2/yearDouglas fir46.46 kg CO2/yearPine14.39 kg CO2/yearLarch35.91 kg CO2/yearBeyond carbon sequestration, it is important to note that trees perform many other functions: they improve soil health, help to filter water, and aid the hydrological cycle. For a more detailed analysis of the financial value of trees, see i-Tree. (n.d.). MyTree. https://mytree.itreetools.org/#/ ↵
- US Environmental Protection Agency (2023). ↵
- Michaelson, J. (2017, April 29). The hero of the People’s Climate March: Wal-Mart? The Daily Beast. http://www.thedailybeast.com/articles/2017/04/29/the-hero-of-the-people-s-climate-march-wal-mart ↵
- Mandel, K. (2021, September 13). Walmart has a plan to tackle the climate crisis. Can it pull it off? The Guardian. https://www.theguardian.com/environment/2021/sep/13/walmart-climate-change-plan-can-it-work. In 2023, Walmart agreed to settle a case of greenwashing mislabeling products made with rayon as made with bamboo. See Deo, H., & Jin, B. E. (2023, December 4). What is greenwashing and why are more companies being accused of it? Wilson College News. https://textiles.ncsu.edu/news/2023/12/what-is-greenwashing-and-why-are-more-companies-being-accused-of-it/ ↵
- Horowitz, J., & Mullen, J. (2017, June 2). Top CEOs tell the CEO president: You’re wrong on Paris. CNN Money. http://money.cnn.com/2017/06/01/news/ceos-respond-trump-paris-agreement/index.html ↵
- Critics point out that these solutions may create greater problems, provide a false sense of security for solving current problems, and distract people from becoming less dependent on fossil fuels. For further examples and discussion, see McIlroy, A. (2006, June 3). Going to global extremes to fight global warming. The Globe and Mail, A1 and A8. ↵
- Richter, F. (2023, May 19). Cars still dominate the American commute. Statista. https://www.statista.com/chart/18208/means-of-transportation-used-by-us-commuters/; Cycling Embassy of Denmark. (n.d.). Danish cycling statistics. https://cyclingsolutions.info/embassy/danish-cycling-statistics/. According to the following study, in 2019 in Copenhagen, Denmark, 44 percent of trips for work and education are made by bike, 27 percent by public transit, 22 percent by car, and 7 percent walking: Weinreich, M. (2021, Feb 3). Cycling Copenhagen: The making of a bike-friendly city. Heinrich Böll Stiftung, Brussels, European Union. https://eu.boell.org/en/cycling-copenhagen-the-making-of-a-bike-friendly-city# ↵
- The amount saved is from a study in Denmark which refers to 0.8 Euro/km. The exchange rate of February 6, 2025 was EUR 0.8 = USD[lxxv].83. Cycling Embassy of Denmark (n.d., retrieved July 11, 2024). ↵
- The time associated with owning a car takes into account the hours we spend working to pay for the car, to maintain it, to drive it, and so on. ↵
- For example, see Peters, A. (2024, February 9). The newest company perk? An e-bike subscription. Fast Company. https://www.fastcompany.com/91025277/the-newest-company-perk-an-e-bike-subscription. ↵
- For more on Scope 3 emissions, see EPA Center for Corporate Climate Leadership. (2025). Scope 3 inventory guidance. US Environmental Protection Agency. https://www.epa.gov/climateleadership/scope-3-inventory-guidance#; Yale Sustainability. (2023, November 14). Yale experts explain Scope 3 emissions. https://sustainability.yale.edu/explainers/yale-experts-explain-scope-3-emissions ↵
- Boyd, D. (2014, March 3). Enshrine our right to clear air and water in the Constitution. Policy Options Politiques. http://policyoptions.irpp.org/magazines/opening-eyes/boyd-macfarlane/ ↵
- Cline, E. (2012). Overdressed: The shockingly high cost of cheap fashion. Penguin Portfolio. ↵
- Hunter, A. (2023). Sheep, shepherd and land: Stories from small farms reinvigorating Canadian wool. Moe Ten Publications. ↵
- For more on the “hidden price tag” on blue, see GreenovateChina. (2011, December 16). The secret lives of our clothes [Video]. https://www.youtube.com/watch?v=TVBxlMx6nK4. See also Fashion Revolution. (2015, April 23). The 2 euro t-shirt—A social experiment [Video]. https://www.youtube.com/watch?v=KfANs2y_frk ↵
- In contrast, one study suggests that the wages of sewing workers in Asian garment factories are in the range of about 50 to 85 percent of a living wage. While the cost of raising their pay to a living wage would be equivalent to, on average, a 4 percent increase of the final consumer price, under current industry practices the price increase would be greater because of supply chain increases: factory wages get “marked up” on a percentage basis, so that a increase in factory wages might result in increase in consumer price. Lally, A., & Spauwen, I. (2014). Living wage engineering. Fair Wear Foundation. https://www.fairwear.org/ul/cms/fck-uploaded/documents/fwfpublications_reports/LivingWageEngineering20141.pdf ↵
- Ritchie, H. (2021, August 6). Smallholders produce one-third of world’s food, less than half of what many headlines claim. Our World in Data. https://ourworldindata.org/smallholder-food-production; Locke, H. (2015, July 27). Smallholder farmers are the new global food frontier. Huffington Post. http://www.huffingtonpost.com/hugh-locke/smallholder-farmers-are-t_b_7865848.html ↵
- Haberl, H., Erb, K. H., & Krausmann, F. (2014). Human appropriation of net primary production: Patterns, trends, and planetary boundaries. Annual Review of Environment and Resources, 39: 363–391. http://dx.doi.org/10.1146/annurev-environ-121912-094620 ↵
- Agronomists and international development professionals suggest that “multifunctional agriculture” would be much more sustainable for the vast majority of the world’s farmers, in particular small-scale farms in low-income countries. Multifunctional agriculture emphasizes innovations that are sustainable and foster biodiversity and facilitate community development, identifying conservation agriculture (see this chapter’s opening case) to be of particular importance in low-income countries. See Hurni, H., & Osman-Elasha, B. (2009). Context, conceptual framework, and sustainability indicators. In McIntyre, B. D., Herren, H. R., Wakhungu, J., & Watson, R. T. (Eds.), Agriculture at the crossroads (pp. 1–56). IAASTD; Stokstad, E. (2008). Dueling visions for a hungry world. Science, 319: 1474–1476. https://doi.org/10.1126/science.319.5869.1474; Wood, D., & Lenne, J. M. (2011). Can the international assessment of agricultural knowledge, science and technology for development (IAASTD) approach ensure future food security? In Lenne, J. M., & Wood, D. (Eds.), Agrobiodiversity management and food security: A critical review (pp. 170–188). CAB International. ↵
- Bayliss-Smith, T. P. (1982). The ecology of agricultural systems. Cambridge University Press. See also Dyck, B. (1994). Build in sustainable development, and they will come: A vegetable field of dreams. Journal of Organizational Change Management, 7(4): 47–63. https://doi.org/10.1108/09534819410061379 ↵
- Haberl et al. (2014). ↵
- See page 164 in Princen, T., Manno, J. P., & Martin, P. (2013). Keep them in the ground: Ending the fossil fuel era. In Worldwatch Institute, State of the world 2013: Is sustainability still possible? (Chapter 14, 161–171). This section has benefitted from comments by Gary Martens, University of Manitoba. ↵
- Haberl et al. (2014). ↵
- Utuk, I. O., & Daniel, E. E. (2015). Land degradation: A threat to food security: A global assessment. Journal of Environment and Earth Science, IISTE, 5: 13–21. ↵
- Over the past 300 years, about 100 million hectares of irrigated land have been destroyed and another 110 million suffer diminished productivity. When land is deemed to be desertified, some authors maintain that this “refers to irreversible decline in the biological potential of the land” (Utuk & Daniel, 2015: 14). ↵
- Annual production in hectares as follows: corn (823 billion tons from 161 million hectares); wheat (689 billion tons from 222 million hectares); and rice (685 billion tons from 160 million hectares). Goldschein, E. (2011, September 20). The 10 most important crops in the world. Business Insider. http://www.businessinsider.com/10-crops-that-feed-the-world-2011-9. Corn, rice, wheat, and soybeans account for 64 percent of global calories in food. Jastive, K. (2014, November 20). Carbon cycle shifts as corn “explodes.” Organic Consumers Association. https://organicconsumers.org/article_31541/ ↵
- Ford, A. (2008, August 1). King corn: Documentary film reveals how subsidized corn is driving the fast-food industry. The Edge. http://www.edgemagazine.net/2008/08/king-corn-documentary-film-reveals-how-subsidized-corn-is-driving-the-fast-food-industry/ ↵
- Page 75 in Hahn Niman, N. (2014). Defending beef: The case for sustainable meat production. Chelsea Green Publishing. ↵
- Schechinger, A. A. (2015, June 9). Farm nitrogen pollution damage estimated at 7 billion yearly. EWG (Environmental Working Group). https://www.ewg.org/news-insights/news/farm-nitrogen-pollution-damage-estimated-157-billion-yearly; cited in Lehner, P. (2016, August 16). The hidden costs of food. Huffington Post. http://www.huffingtonpost.com/peter-lehner/the-hidden-costs-of-food_b_11492520.html. Additionally, since the discovery about a century ago of the Haber-Bosch process, which creates fertilizer from atmospheric nitrogen that is unreactive, the nitrogen cycle has been altered massively in the past century and is in the danger zone. Steffen et al. (2015). ↵
- Healthcare costs for sugar-related issues have been reported at about trillion, and 7 percent of the global sweetener market occupied by high-fructose corn syrup. Keating, G., & Natella, S. (2013, September). Sugar: Consumption at a crossroads. Credit Suisse Research Institute. https://www.credit-suisse.com/media/assets/corporate/docs/about-us/research/publications/sugar-en.pdf. See also Lehner (2016). ↵
- Ciolkosz, D. (2024, July 8). Fuel ethanol: Hero or villain? Penn State Extension. https://extension.psu.edu/fuel-ethanol-hero-or-villain ↵
- Shahbandeh, M. (2025, January 28). Number of cattle worldwide from 2012 to 2023. Statista. https://www.statista.com/statistics/263979/global-cattle-population-since-1990/; Shahbandeh, M. (2025, February 6). Number of chickens worldwide from 1990 to 2023. Statista. https://www.statista.com/statistics/263962/number-of-chickens-worldwide-since-1990/; Shahbandeh, M. (2024, June 14). Number of pigs worldwide from 2012 to 2024. Statista. https://www.statista.com/statistics/263963/number-of-pigs-worldwide-since-1990/; World Population Review. (n.d.). Sheep population by country 2024. https://worldpopulationreview.com/country-rankings/sheep-population-by-country ↵
- Based on the average population of 3,706 species of vertebrates on the planet (all mammals, birds, reptiles, fish and amphibians), the drop in land animals was 38 percent. World Wildlife Fund. (n.d.). Living planet report 2022: Wildlife populations plummet by 69 percent. https://livingplanet.panda.org/en-US/ ↵
- Hahn Niman (2014). ↵
- Searchinger, T., Waite, R., Hanson, C., Ranganathan, J., & Dumas, P. (2019, July). World resources report: A menu of solutions to feed nearly 10 billion people by 2050. The World Bank, UNEP, UNDO, CIRAD, and INRA. https://research.wri.org/sites/default/files/2019-07/WRR_Food_Full_Report_0.pdf. In 2019, transportation emitted 15 percent of global GHG emissions, and agriculture, forestry and other land use emitted 22 percent. Global greenhouse gas overview. (2024, September 10). US Environmental Protection Agency. https://www.epa.gov/ghgemissions/global-greenhouse-gas-overview ↵
- Time for Change. (n.d.). Are cows the cause of global warming? http://timeforchange.org/are-cows-cause-of-global-warming-meat-methane-CO2. This post cites Ogino, A., Orito, H., Shimada, K., & Hirooka, H. (2007). Evaluating environmental impacts of the Japanese beef cow–calf system by the life cycle assessment method. Animal Science Journal, 78(4): 424–432. http://dx.doi.org/10.1111/j.1740-0929.2007.00457.x ↵
- Simon, D. R. (2013). Meatonomics: How the rigged economics of meat and dairy make you consume too much—and how to eat better, live longer, and spend smarter. Conari Press. ↵
- Steffen et al. (2015). ↵
- Monoculture assures that all the plants in a field will ripen at about the same time, enabling farmers to use large machinery to harvest their crops. However, monoculture also leaves crops vulnerable to a single pest, thus increasing the need for pesticides. For impacts on wildlife, see World Wildlife Fund (2016). ↵
- Clark, N. E., Lovell, R., Wheeler, B. W., Higgins, S. L., Depledge, M. H., & Norris, K. (2014). Biodiversity, cultural pathways, and human health: A framework. Trends in Ecology & Evolution, 29(4): 198–204. http://dx.doi.org/10.1016/j.tree.2014.01.009 ↵
- This concentration of power has been facilitated by international trade liberalization (World Wildlife Fund, 2016). ↵
- Small-scale farms (1 to 2 hectares, 84 percent of farms) use 12 percent of land; 72 percent of farms are less than 1 hectare and use 8 percent of land (World Wildlife Fund, 2016). ↵
- USDA Details Market Shares of Biggest Seed Industry Players. (2023, October 4). Seed World U.S. https://www.seedworld.com/us/2023/10/04/usda-details-market-shares-of-biggest-seed-industry-players/ ↵
- World Wildlife Fund (2016). ↵
- World Wildlife Fund (2016). ↵
- Hendriks, S., de Groot Ruiz, A., Herrero Acosta, M., Baumers, H., Galgani, P., Mason-D’Croz, D. . . . Watkins, M. (2021, June). The true cost and true price of food. United Nations Food Systems Summit, Scientific Group. https://sc-fss2021.org/wp-content/uploads/2021/06/UNFSS_true_cost_of_food.pdf ↵
- Our World in Data. Share of expenditure spent on food vs. total consumer expenditure, 2022. (2022). https://ourworldindata.org/grapher/food-expenditure-share-gdp?tab=table ↵
- Gunders, D. (2012, August). Wasted: How America is losing up to 40 percent of its food from farm to fork to landfill (NRDC Issue Paper 12-06-B). Natural Resources Defense Council. https://www.nrdc.org/sites/default/files/wasted-food-IP.pdf ↵
- Goodwin, L. (2017, March 6). By the numbers: The business case for reducing food loss and waste. World Resources Institute. http://www.wri.org/blog/2017/03/numbers-business-case-reducing-food-loss-and-waste ↵
- Gunders (2012). ↵
- Cummins, R. (2015, March 31). Factory farm meat: Why vegetarians, ranchers, and conscious omnivores need to unite. Organic Consumers Association. https://www.organicconsumers.org/essays/factory-farm-meat-why-vegetarians-ranchers-and-conscious-omnivores-need-unite ↵
- Timmer, A. D. (2015). Place-based responses to the global food economy. In K. M. Fitzpatrick & D. Willis (Eds.), A place-based perspective of food in society (pp. 203–220). Palgrave Macmillan. ↵
- “Beginning with the first Agricultural Adjustment Act of 1933, [US] Congress and the courts have built a safety net of statutory exclusions and economic subsidies to support what has become known as ‘conventional agriculture’: large-scale, highly-mechanized, monocultural plant and animal production.” Foscolo, J., & Zimmerman, M. (2014). Alternative growth: Forsaking the false economies of industrial agriculture. Fordham Environmental Law Review, 25(2): 316. https://ir.lawnet.fordham.edu/elr/vol25/iss2/2 ↵
- “These include costs such as water testing, testing compost materials, installing deer fencing, building an enclosed packing house, switching to all plastic harvest bins, renting port-a-potties with hand washing stations and the most time-consuming task of endless record-keeping. The record-keeping of organic certification will pale in comparison with food safety record-keeping. Things like daily temperature checks, recording when you pump, clean, and restock your bathrooms, recording when your employees wash their hands, how many deer footprints you found in a particular field, lot numbers for every box of produce you harvest, etc.” Collins, J. (2016, April 1). Small farms are getting regulated out of business. In These Times. http://inthesetimes.com/rural-america/entry/19012/the-food-safety-and-modernization-act-has-consequences-for-small-farmers ↵
- Weber, K., Heinze, K. L., & DeSoucey, M. (2008). Forage for thought: Mobilizing codes in the movement for grass–fed meat and dairy products. Administrative Science Quarterly, 53(3): 529–567. http://dx.doi.org/10.2189/asqu.53.3.529 ↵
- Shahbandeh, M. (2024, May 23). Organic food sales in the United States from 2005 to 2023. Statista. https://www.statista.com/statistics/196952/organic-food-sales-in-the-us-since-2000/#statisticContainer ↵
- Goodwin (2017). ↵
- These investments can come from governments and/or other stakeholders (Goodwin, 2017). ↵
- Baden-Mayer, A., & Cummins, R. (2014, May 7). NOSB meeting report: Big food pushes for weaker organic standards: Consumers win on antibiotics. Organic Consumers Association. https://organicconsumers.org/article_29964/; Besharov, M. (2017). Review of Organizing organic: Conflict and compromise in an emerging market, by M. A. Haedicke (2016), Stanford University Press. Organization Studies, 38(2): 285–288. https://doi.org/10.1177/0170840616673802; Michaelis, K. (2013). USDA guts organic standards. Food Renegade. http://www.foodrenegade.com/usda-guts-organic-standards/#comments ↵
- Weber et al. (2008). ↵
- Michener, L. H. (2015). Meating America’s demand: An analysis of the hidden costs of factory farming and alternate methods of food production. Journal of Animal & Environmental Law, 7(1): 145–185. https://drive.google.com/file/d/0B0gcImiUSq5ERVhITWxZTXdPZVU/view?resourcekey=0-FBuSq_4-iwDcESNZJ4BBYA ↵
- More sustainable practices generate between 0 and ,240 per hectare, whereas industrial agriculture generates to 4. Sandhu, H. S., Wratten, S. D., Cullen, R., & Case, B. (2008). The future of farming: The value of ecosystem services in conventional and organic arable land. An experimental approach. Ecological Economics, 64(4): 835–848. http://dx.doi.org/10.1016/j.ecolecon.2007.05.007 ↵
- Tencati, A., & Zsolnai, L. (2012). Collaborative enterprise and sustainability: The case of Slow Food. Journal of Business Ethics, 110: 345–354. http://dx.doi.org/10.1007/s10551-011-1178-1 ↵
- See page 346 in Tencati & Zsolnai (2012). ↵
- Chaudhury, S. R., & Albinsson, P. A. (2015). Citizen-consumer oriented practices in naturalistic foodways: The case of the Slow Food Movement. Journal of Macromarketing, 35(1): 36–52. https://doi.org/10.1177/0276146714534264 ↵
- Garcia, M. (2024, February 11). Is rise of veganism putting pressure on meat industry? Industry Leaders. https://www.industryleadersmagazine.com/is-rise-of-veganism-putting-pressure-on-meat-industry/ ↵
- D’Andrea, A. (2024, April 12). In sweeping new report, more than 200 climate scientists urge consumers, governments to move toward plant-based diets. Forks over Knives. https://www.forksoverknives.com/wellness/sweeping-new-report-climate-scientists-urge-consumers-governments-toward-plant-based-diets/ ↵
- Youmshajekian, L. (November 8, 2023). How do ultraprocessed foods affect your health? Scientific American. https://www.scientificamerican.com/article/how-do-ultraprocessed-foods-affect-your-health; Global Food Research Program. (May 20, 2021). Ultra-processed foods: A global threat to public health. University of North Carolina at Chapel Hill. https://www.globalfoodresearchprogram.org/wp-content/uploads/2021/04/UPF_ultra-processed_food_fact_sheet.pdf ↵
- McMichael, A. J. (2014). Population health in the Anthropocene: Gains, losses and emerging trends. The Anthropocene Review, 1(1): 44–56. https://doi.org/10.1177/2053019613514035 ↵
- McMichael (2014). ↵
- McMichael (2014). ↵
- McMichael (2014). ↵
- McMichael (2014). ↵
- Dellorto, D. (2012, December 14). Global report: Obesity bigger health crisis than hunger. CNN. http://www.cnn.com/2012/12/13/health/global-burden-report/ ↵
- “This number includes costs associated with obesity treatment and obesity-related conditions and costs associated with attendance and productivity at work as they relate to obesity.” Obesity Medicine Association. (July 25, 2023). How much does obesity cost the U.S? https://obesitymedicine.org/blog/health-economic-impact-of-obesity/ ↵
- 6.7 million premature deaths annually are linked to air pollution. See World Health Organization. (2024, October 24). Ambient (outdoor) air pollution. https://www.who.int/news-room/fact-sheets/detail/ambient-(outdoor)-air-quality-and-health ↵
- Velasquez-Manoff, M. (2016, August 3). Health secrets of the Amish. The New York Times. https://www.nytimes.com/2016/08/04/opinion/health-secrets-of-the-amish.html. Amish children in the United States are the least allergic subgroup ever tested in the developed world, and a key to their health may be exposure to microbes related to the nearness to living to cows. ↵
- Markandya, A., Saygin, D., Miketa, D., Gielen, D., & Wagner, N. (2016). The true cost of fossil fuels: Savings on the externalities of air pollution and climate change. International Renewable Energy Agency. https://www.irena.org/-/media/files/irena/agency/publication/2016/irena_remap_externality_brief_2016.pdf ↵
- International Labour Organization. (2023, November 26). Nearly 3 million people die of work-related accidents and diseases. https://www.ilo.org/resource/news/nearly-3-million-people-die-work-related-accidents-and-diseases. Of these, about 330,000 are from work accidents, and the rest form work-related diseases. ↵
- Kaplan, K. (2016, October 16). You can blame cigarettes for nearly 3 in 10 cancer deaths in the U.S., study says. The Los Angeles Times. http://www.latimes.com/science/sciencenow/la-sci-sn-cancer-deaths-smoking-20161024-snap-story.html ↵
- Schick & Glantz (2005). ↵
- Rabin, R. C. (2017, May 15). A strong case against a pesticide does not faze E.P.A. under Trump. The New York Times. https://www.nytimes.com/2017/05/15/health/pesticides-epa-chlorpyrifos-scott-pruitt.html. Similarly, Michael Pollan describes how about 70 percent of American cornfields have been treated with a pesticide called Atrazine, which has been banned in the European Union because even concentrations as low as 0.1 part per billion will chemically emasculate a male frog. Atrazine is currently present in American waterways at much higher levels than that. See Pollan, M. (2006, June 4). The way we live now: Mass Natural. The New York Times Magazine. http://www.nytimes.com/2006/06/04/magazine/04wwln_lede.html ↵
- McDonald’s pledged to remove antibiotics that are important to human medicine from the chicken product is offered by 2018. Wright, L. (2017, June 11). A peek inside MacDonald’s top secret convention. Toronto Star. https://www.thestar.com/business/2017/06/11/exclusive-a-peek-inside-mcdonalds-top-secret-convention.html. McDonald’s has been lauded for reducing GHG emissions and pollution when it changed the dimpling pattern on its napkins. This meant that it could fit 25 percent more napkins in a box, thus reducing resources to manufacture boxes and transportation costs and fossil-fuel emissions to ship them. See page 128 in Martin & Schouten (2012). ↵
- Robbins, J. (2017, December 6). How bad is McDonald’s food? Huffington Post. http://www.huffingtonpost.com/john-robbins/how-bad-is-mcdonalds-food_b_754814.html ↵
- These figures include beef cattle only (to add dairy, multiply by 1.66). See USDA Economic Research Service. (2024, June 6). Corn and other feed grains. https://www.ers.usda.gov/topics/crops/corn-and-other-feed-grains. Corn uses by far more fertilizers, herbicides, and insecticides than any other crop in the United States, making it the country’s largest contributor to water pollution (Hahn Niman, 2014: 75). ↵
- Silva, H., Teno, S. C., & Júdice, P. B. (2024). Are there compensatory behaviors in response to a sit-stand desk intervention? Journal of Occupational Health, 66(1): uiae067. https://doi.org/10.1093/joccuh/uiae067; Watson, S. (with Brakeville, R.). (2023, September 11). Standing desks: How they help you beat inactivity. WebMD. https://www.webmd.com/fitness-exercise/standing-desks-help-beat-inactivity ↵
- Qian, C., Balaji, P., Crilly, D., & Liu, Y. (2024). Better safe than sorry: CEO regulatory focus and workplace safety. Journal of Management, 50(4): 1453–1487. https://journals.sagepub.com/doi/abs/10.1177/01492063221146754#tab-contributors ↵
- Tilman, D., & Clark, M. (2014). Global diets link environmental sustainability and human health. Nature, 515: 518–522. https://www.nature.com/articles/nature13959 ↵
- Percentage figures from Aleksandrowicz, L., Green, R., Joy, E. J., Smith, P., & Haines, A. (2016). The impacts of dietary change on greenhouse gas emissions, land use, water use, and health: A systematic review. PLOS One, 11(11): e0165797. https://doi.org/10.1371/journal.pone.0165797. On life-cycle assessments, see Nelson, M. E., Hamm, M. W., Hu, F. B., Abrams, S. A., & Griffin, T. S. (2016). Alignment of healthy dietary patterns and environmental sustainability: A systematic review. Advances in Nutrition: An International Review Journal, 7(6): 1005–1025. https://doi.org/10.3945/an.116.012567 ↵
- Richkus, W. A. (2013). Role of ecological risk assessment findings in agency decision-making regarding oyster restoration in Chesapeake Bay. Human and Ecological Risk Assessment, 19(5): 1253–1263. https://doi.org/10.1080/10807039.2013.767113 ↵
- Kazemi, Z., Aboutaleb, E., Shahsavani, A., & Kermani, M., (2022). Evaluation of pollutants in perfumes, colognes and health effects on the consumer: A systematic review. Journal of Environmental Health Science and Engineering, 20(5): 589–598. http://dx.doi.org/10.1007/s40201-021-00783-x ↵
- Neal, M. (2011, May 25). Toxic everyday chemicals may be harming kids, Senate panel told. Huffpost. https://www.huffpost.com/entry/toxic-everyday-chemicals-_n_774279 ↵
- Brookshire, D., & Kaza, N. (2013). Planning for seven generations: Energy planning of American Indian tribes. Energy Policy, 62: 1506–1514. http://dx.doi.org/10.1016/j.enpol.2013.07.021 ↵
- Hunt, R., Ortiz-Hunt, L. (2017). Entrepreneurial round-tripping: The benefits of newness and smallness in multi-directional value creation. Management Decision, 55(3): 491–511. http://dx.doi.org/10.1108/MD-07-2016-0475 ↵
- Goldenberg, S. (2014, January 19). CO2 emissions are being “outsourced” by rich countries to rising economies. The Guardian. https://www.theguardian.com/environment/2014/jan/19/co2-emissions-outsourced-rich-nations-rising-economies ↵
- Whyte, C. (2017, March 29). Western demand for goods from China killing 100,000 a year. New Scientist. https://www.newscientist.com/article/2126127-western-demand-for-goods-from-china-is-killing-100000-a-year/ ↵
- Wani, I. (2017, May 7). Photo story: How e-waste workers in Delhi jeopardise their health to earn a living. The Wire. https://thewire.in/132025/photo-story-the-e-waste-workers-of-delhi/; Zeng, A. Z. (2013). Coordination mechanisms for a three-stage reverse supply chain to increase profitable returns. Naval Research Logistics, 60(1): 31–45. http://dx.doi.org/10.1002/nav.21517 ↵
- Thanks to Alberta’s oil sands (a 144,000-square-kilometer area north of Edmonton), Canada has the third largest oil reserves in the world (173 billion barrels, behind only Venezuela and Saudi Arabia and more than Iran and Iraq). Crane, A., & Matten, D. (2016). Business ethics: Managing corporate citizenship and sustainability in the age of globalization (4th ed.). Oxford University Press. One of the earliest entrepreneurs to seek to exploit the oil sands was Robert Fitzsimmons, who developed a community called Bitumount—half industrial yard, half homestead—in the 1920s and promoted thirty-eight ways that bitumen could be used, including for road paving, therapeutic baths, and home roofing. His crews produced sixty barrels of oil a day. A serial entrepreneur named Lloyd Champion bought out Fitzsimmons in 1942, recognizing that bitumen would help to pave the Alaska highway under construction at that time. See Weber, B. (2017, May 18). Back to Bitumount: How oilsands changed Alberta and Canada forever. The Record. https://www.therecord.com/news-story/7323882-back-to-bitumount-how-the-oilsands-changed-alberta-and-canada-forever/ ↵
- Based on 2021 data. City of Calgary. (n.d.). Data about Calgary’s population. Retrieved July 12, 2024, from https://www.calgary.ca/research/population-profile.html ↵
- Verbeke, A., Osiyevskyy, O., & Backman, C. A. (2017). Strategic responses to imposed innovation projects: The case of carbon capture and storage in the Alberta oil sands industry. Long Range Planning, 50(5): 684–698. http://dx.doi.org/10.1016/j.lrp.2017.03.002 ↵
- Crane & Matten (2016: 127). The Sierra Club is the largest environmental NGO in the United States. ↵
- In 2022, the oil sands used 1,059 million cubic meters of water (equivalent to the amount used in 10 million households) to produce the equivalent of 669 barrels of oil. Alberta Energy Regulator. (2024, December). Oil sands mining. https://www.aer.ca/protecting-what-matters/holding-industry-accountable/industry-performance/water-use-performance/oil-sands-mining-water-use. Past estimates suggest that about 11 million liters of toxic waters seep every day from the tailing ponds (tailings are a toxic waste by-product that comes from extracting oil form bitumen) (Crane & Matten, 2016). ↵
- Norwood, F. B., & Bir, C. (2022, March 10). 1 in 10 Americans say they don’t eat meat—a growing share of the population. Alliance for Science. https://allianceforscience.org/blog/2022/03/1-in-10-americans-say-they-dont-eat-meat-a-growing-share-of-the-population/ ↵
- Starostinetskaya, A. (2024, January 15). Nearly 40 percent of Americans want to eat less red meat. Beyond Meat says its steak is just the thing. VegNews. https://vegnews.com/americans-red-meat-beyond-steak ↵
- Benedict. (2017, May 3). 3D printed beef can create “more value” for farmers, says Meat & Livestock Australia. 3Ders. http://www.3ders.org/articles/20170503-3d-printed-beef-can-create-more-value-for-farmers-says-meat-livestock-australia.html; Jha, A. (2013, August 5). Synthetic meat: How the world's costliest burger made it on to the plate. The Guardian. https://www.theguardian.com/science/2013/aug/05/synthetic-meat-burger-stem-cells ↵
- Kolodny, L. (2017, May 22). Impossible Foods CEO Pat Brown says VCs need to ask harder scientific questions. Techcrunch. https://techcrunch.com/2017/05/22/impossible-foods-ceo-pat-brown-says-vcs-need-to-ask-harder-scientific-questions/ ↵
- Information taken from Sweetgreen website: https://www.sweetgreen.com/mission. As reported elsewhere, its profitability has been a concern. See Wall Street Journal. (2023, September 19). Why Sweetgreen is losing millions of dollars every month [Video]. https://www.youtube.com/watch?v=s5drsQAsTzA ↵
- Roberts, M. (2017, June 12). “Seductive names” make vegetables more appealing. BBC. http://www.bbc.com/news/health-40245922 ↵
- The description in this paragraph is drawn from Leonard, A. (2013). Moving from individual change to societal change. In Worldwatch Institute, State of the world 2013: Is sustainability still possible? (Chapter 23, pp. 244–252). According to its website, Keep America Beautiful (KAB) is a million charity with millions of volunteers and a mission to inspire and educate people “to take action every day to improve and beautify their community environment.” Keep America Beautiful. (n.d.). About KAB. https://kab.org/about-keep-america-beautiful/ ↵
- Martin & Schouten (2012: 186–187). ↵
- Jobling-Hey, A. (2012, August 21). Plastic water bottles and the environment: How bad is bad? Bizenergy.ca Blog. http://www.bizenergy.ca/blog/plastic-water-bottles-and-the-environment-how-bad-is-bad/ ↵
- Steffen, W., Richardson, K., Rockström, J., Cornell, S. E., Fetzer, I., Bennett, E. M., . . . Sörlin, S. (2015, January 15). Planetary boundaries: Guiding human development on a changing planet. Science, 347(6223): 1259855. https://doi.org/10.1126/science.1259855 ↵
- The cubes are 4 meters wide, 3 meters tall, and 2 meters deep. Giles, C. (2017, June 7). This “tree” has the environmental benefits of a forest. CNN. http://www.cnn.com/2017/06/07/world/citytree-urban-pollution/ ↵
- Peters, A. (2017, May 30). These shoes help clean lakes—because they’re made of polluting algae. Fast Company. https://www.fastcompany.com/40425032/these-shoes-help-clean-lakes-because-theyre-made-of-polluting-algae ↵
A condition evident when the Earth’s natural systems are functioning in a way that sustains and enhances the flourishing of life. (See section 4.2)
All living and non-living things that have not been created by human technology or human activity. (See section 4.2)
The amount of the Earth’s natural resources that are required to sustain a particular lifestyle or activity. (See section 4.2)
Deliberately using misleading information in order to present a false image of ecological responsibility. (See section 3.3.2)
Areas where there could be ecological benefits and financial savings in the overall process of how an organization sources raw materials, transforms them into new products, sells them to customers, and how they are used, maintained, and disposed of by consumers. (See section 4.2.1)
Ensuring that the material content of products at the end of their useful life can be reused to make new products and that new products are made from expired products. (See section 4.2.1)
An organizational approach characterized by having ownership, productive activities, and resources located in a specific geographic location. (See section 4.2.1)
People whose diet consists only or principally of locally grown or produced food. (See section 4.2.3)
A principle that states that before anyone undertakes on action that has a reasonable risk of harming others or the environment, that person must demonstrate that the action is not harmful. (See section 4.2.4)

Feedback/Errata