87 Gibbs Energy and Equilibrium
Learning Objectives
By the end of this section, you will be able to:
- Understand how Gibbs free energy change is a driving force, related to reaction quotients, Q.
- Relate standard Gibbs energy changes to equilibrium constants
In Section 74, we learned that Gibbs free energy change for a process may be viewed as a measure of its driving force. A negative value for ΔG represents a driving force for the process in the forward direction, while a positive value represents a driving force for the process in the reverse direction. When ΔG is zero, the forward and reverse driving forces are equal, and the process occurs in both directions at the same rate (the system is at equilibrium).
In Section 85, we introduced the reaction quotient, Q, as a convenient measure of the status of a system. When Q is less than the equilibrium constant, K, the reaction will proceed in the forward direction until equilibrium is reached and Q = K. Conversely, if Q > K, the process will proceed in the reverse direction until equilibrium is achieved. If Q = K, the system is already at equilibrium.
Thus, one can use EITHER ΔG or the relationship between Q and K to determine whether or not a reaction will spontaneously proceed towards reactants or products, or if it is already at equilibrium: this qualitative relationship is summarized in Table 87-1 below.
| Table 87-1: Qualitative Relationship between Q (relative to K) and ΔG | ||
|---|---|---|
| Q | ΔG° | Spontaneous direction of reaction |
| Q < K | < 0 | Products are favoured. |
| Q = K | > 0 | Reaction is at equilibrium. |
| Q > K | = 0 | Reactants are favoured. |
There is also a quantitative relationship between ΔG and Q. The Gibbs energy change for a process taking place with reactants and products present under nonstandard conditions (pressures other than 1 bar; concentrations other than 1 M) is related to the standard Gibbs energy change (ΔGo) according to this equation:
where R is the gas constant (8.314 J K-1 mol-1), T is the absolute temperature (in Kelvin), and Q is the reaction quotient. This equation may be used to predict the spontaneity for a process under any given set of conditions as illustrated the example below.
Example:
Calculating ΔG under Nonstandard Conditions
What is the free energy change for the process shown here under the specified conditions?
2 NH3(g) → 3 H2(g) + N2(g); ΔGo = 33.0 kJ mol-1
T = 25 oC, PN2 = 0.870 atm, PH2 = 0.250 atm, and PNH3 = 12.9 atm.
Solution
The equation relating free energy change to standard free energy change and reaction quotient may be used directly:

Since the computed value for ΔG is positive, the reaction is nonspontaneous under these conditions.
Check Your Learning
Calculate the free energy change for this same reaction at 875 °C in a 5.00 L mixture containing 0.100 mol of each gas. Is the reaction spontaneous under these conditions?
Since, for a system at equilibrium, Q = K and ΔG = 0, the previous equation may be written as

This form of the equation provides a useful link between these two essential thermodynamic properties, and it can be used to derive equilibrium constants from standard free energy changes and vice versa. The relationships between standard free energy changes and equilibrium constants are summarized in Table 87-2.
| Table 87-2: Relationships between Standard Free Energy Changes and Equilibrium Constants | ||
|---|---|---|
| K | ΔG° | Composition of an Equilibrium Mixture |
| > 1 | < 0 | Products are more abundant |
| < 1 | > 0 | Reactants are more abundant |
| = 1 | = 0 | Reactants and products are comparably abundant |
Example:
Calculating an Equilibrium Constant using Standard Free Energy Change
Given that the standard free energies of formation of Ag+(aq), Cl−(aq), and AgCl(s) are 77.1 kJ mol-1, −131.2 kJ mol-1, and −109.8 kJ mol-1, respectively, calculate the solubility product, Ksp, for AgCl.
Solution
The reaction of interest is the following:
![\text{AgCl}\left(s\right)\phantom{\rule{0.2em}{0ex}}\rightleftharpoons\phantom{\rule{0.2em}{0ex}}{\text{Ag}}^{\text{+}}\left(aq\right)+{\text{Cl}}^{\text{−}}\left(aq\right)\phantom{\rule{5em}{0ex}}{K}_{\text{sp}}=\left[{\text{Ag}}^{\text{+}}\right]\left[{\text{Cl}}^{\text{-}}\right]](https://pressbooks.openedmb.ca/app/uploads/quicklatex/quicklatex.com-fc957bf01c00f83fd7d47a9c27421a45_l3.png "Rendered by QuickLaTeX.com")
The standard free energy change for this reaction is first computed using standard free energies of formation for its reactants and products:
![\begin{array}{}\\ \Delta}G\text{°}=\left[\Delta{G}_{\text{f}}^{°}\left({\text{Ag}}^{\text{+}}\left(aq\right)\right)\phantom{\rule{0.2em}{0ex}}+\Delta}{G}_{\text{f}}^{°}\left({\text{Cl}}^{\text{−}}\left(aq\right)\right)\right]\phantom{\rule{0.2em}{0ex}}-\phantom{\rule{0.2em}{0ex}}\left[\text{Δ}{G}_{\text{f}}^{°}\left(\text{AgCl}\left(s\right)\right)\right]\\ =\left[\text{77.1 kJ/mol}-\text{131.2 kJ/mol}\right]-\left[-\text{109.8 kJ/mol}\right]=\text{55.7 kJ/mol}\end{array}](https://pressbooks.openedmb.ca/app/uploads/quicklatex/quicklatex.com-e54efc2854e2673e59fd6cb981d707d1_l3.png "Rendered by QuickLaTeX.com")
The equilibrium constant for the reaction may then be derived from its standard free energy change:
This result is in reasonable agreement with the value provided in Appendix J.
Check Your Learning
Use the thermodynamic data provided in Appendix G to calculate the equilibrium constant for the dissociation of dinitrogen tetroxide at 25 °C.

To further illustrate the relation between these two essential thermodynamic concepts, consider the observation that reactions spontaneously proceed in a direction that ultimately establishes equilibrium. As may be shown by plotting the free energy change versus the extent of the reaction (for example, as reflected in the value of Q), equilibrium is established when the system’s free energy is minimized (Figure 87.1). If a system consists of reactants and products in nonequilibrium amounts (Q ≠ K), the reaction will proceed spontaneously in the direction necessary to establish equilibrium.
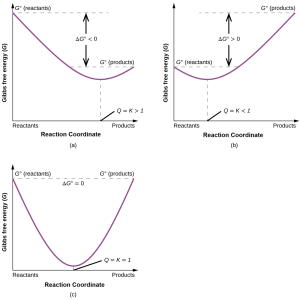 FIGURE 87-1: These plots show the free energy versus reaction progress for systems whose standard free energy changes are (a) negative, (b) positive, and (c) zero. Nonequilibrium systems will proceed spontaneously in whatever direction is necessary to minimize free energy and establish equilibrium.
Section 87 Practice Problems
Click on this link to view the worked answers for these practice problems (as a downloadable pdf).
1. Calculate ΔGo for each of the following reactions from the equilibrium constant at the temperature given.
| (a) | N2(g) + O2(g) → 2NO(g) | T=2000 oC | Kp = 4.1 x 10⁻⁴ |
| (b) | H2(g) + I2(g) → 2HI(g) | T=400 oC | Kp = 50.0 |
| (c) | CO2(g) + H2(g) → CO(g) + H2O(g) | T = 980 oC | Kp = 1.67 |
| (d) | CaCO3(s) → CaO(s) + CO2(g) | T = 900 oC | Kp = 1.04 |
| (e) | HF(aq) + H2O(l) → H3O+(aq) + F–(aq) | T = 25 oC | Kp = 7.2 x 10⁻⁴ |
| (f) | AgBr(s) → Ag+(aq) + Br–(aq) | T = 25 oC | Kp = 3.3 x 10⁻¹³ |
2. Calculate ΔGo for each of the following reactions from the equilibrium constant at the temperature given.
| (a) | Cl2(g) + Br2(g) → 2BrCl(g) | T=25 oC | Kp = 4.7 x 10⁻² |
| (b) | 2SO2(g) + O2(g) → 2SO3(g) | T=500 oC | Kp = 48.2 |
| (c) | H2O(l) → H2O(g) | T = 60 oC | Kp = 0.196 |
| (d) | CoO(s) + CO(g) → Co(s) + CO2(g) | T = 550 oC | Kp = 4.9 x 10² |
| (e) | CH3NH2(aq) + H2O(l) → CH3NH3+(aq) + OH–(aq) | T = 25 oC | Kp = 4.4 x 10⁻⁴ |
| (f) | PbI2(s) → Pb2+(aq) + 2I–(aq) | T = 25 oC | Kp = 8.7 x 10⁻⁹ |
3. Calculate the equilibrium constant at 25 oC for each of the following reactions from the value of the ΔGo provided.
| (a) | O2(g) + 2F2(g) → 2OF2(g) | ΔGo = -9.2 kJ | |
| (b) | I2(s) + Br2(l) → 2IBr(g) | ΔGo = 7.3 kJ | |
| (c) | 2 LiOH(s) + CO2(g) → Li2CO2(s) + H2O(g) | ΔGo = -79 kJ | |
| (d) | N2O3(g) → NO(g) + NO2(g) | ΔGo = -1.6 kJ |
4. What happens to ΔG (i.e., does it become more positive or more negative) for the following chemical reactions when the partial pressure of oxygen is increased?
(a) S(s) + O2(g) → SO2(g)
(b) 2 SO2(g) + O2(g) → 2 SO3(g)
(c) 2 HgO(s) → 2 Hg(l) + O2(g)
5. One of the important reactions in the biochemical pathway glycolysis is the reaction of glucose-6-phosphate (G6P) to form fructose-6-phosphate (F6P): G6P  F6P, which has a standard Gibbs Energy change of 1.7 kJ (ΔGo = 1.7 kJ.
(a) Is the reaction spontaneous or nonspontaneous under standard thermodynamic conditions?
(b) Standard thermodynamic conditions imply the concentrations of G6P and F6P to be 1 M, however, in a typical cell, they are not even close to these values. Calculate ΔG when the concentrations of G6P and F6P are 120 μM and 28 μM respectively, and discuss the spontaneity of the forward reaction under these conditions. Assume the temperature is 37 °C.
